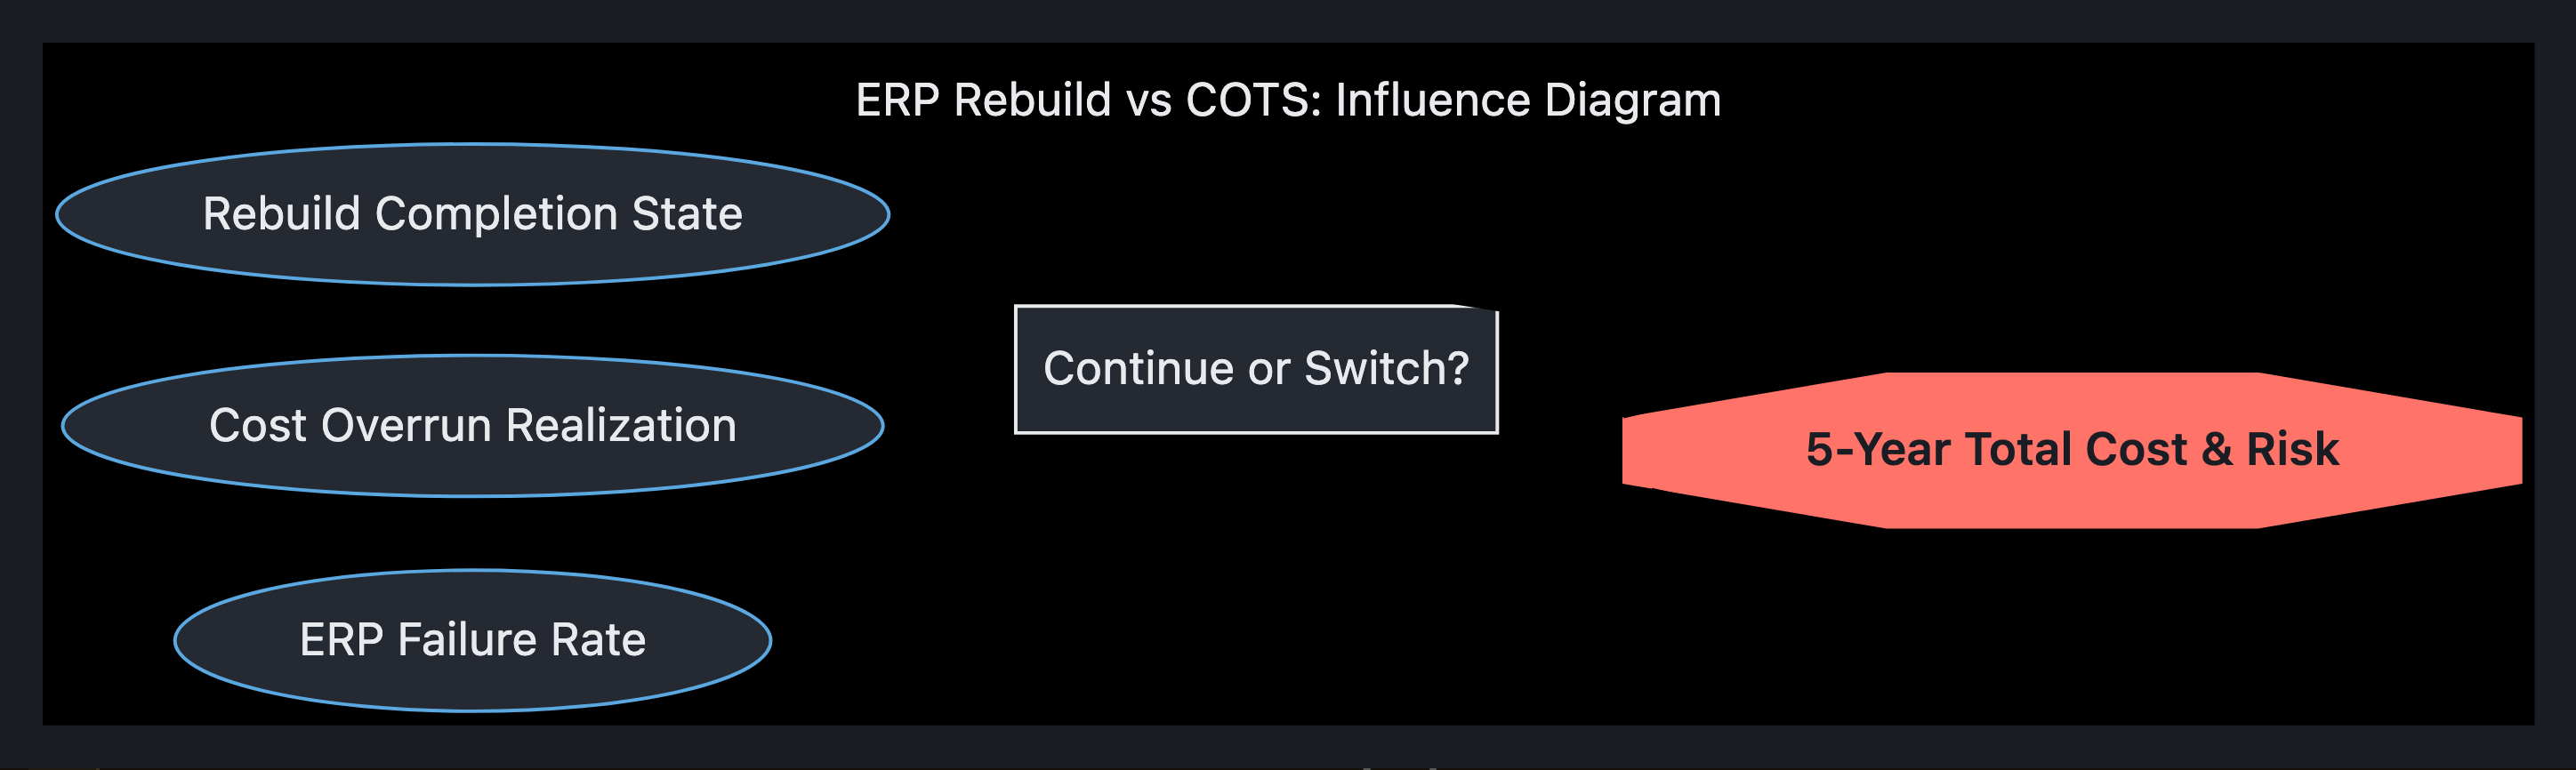
Decision Architecture: In-House ERP Rebuild vs. Off-the-Shelf Switch
A note before the analysis: you’ve given me the one number that should carry the least weight in the forward decision — the $12M and four years already spent — and none of the forward numbers. So I’ve built the full architecture and populated the expected-value section with clearly-flagged illustrative figures. Replace them with your real estimates and the structure does the work. Where a number is a placeholder, it’s marked ‹…›.
1. The decision, stated plainly
Should we commit further capital to completing the in-house ERP rebuild, or stop it now and migrate to an off-the-shelf system?
This is a forward resource-allocation decision, not a verdict on the last four years. The only question that matters: from today, which path produces more value net of the cost still required to get there?
2. The sunk-cost firewall (explicit, as you asked)
The $12M and four years are gone under every option. They are not recoverable by finishing, and they are not “wasted” by stopping — they are spent. They do not appear on either side of the forward ledger.
What the $12M is allowed to do is inform, not justify:
| Sunk cost as a bias (excluded) | Sunk cost as information (admitted) |
|---|
| “We’ve put too much in to quit now." | "Four years revealed our true cost-to-complete rate — use it to forecast the remaining build." |
| "Stopping admits the $12M was a mistake." | "The build surfaced 40 hard requirements we didn’t know we had — that’s a real spec asset, portable to either path." |
| "One more push and it pays off." | "Our historical slip rate on this project is X% — apply it to the remaining estimate.” |
Decision rule: any sentence in the room that uses the $12M to argue for continuation gets struck. Any sentence that uses the track record to sharpen a forward estimate stays.
3. Stakeholders
| Stakeholder | Stake | Likely bias | What they need from this decision |
|---|
| CFO / Finance | Forward burn, total cost of ownership, balance-sheet write-off of capitalized dev | Toward killing (stops the bleed); but a write-off hits the P&L | A clean forward TCO comparison; clarity on the accounting write-off and its timing |
| CIO / Eng leadership | Credibility tied to the rebuild; team morale; technical control | Toward continuing (sunk-cost + reputational) | Cover to make the rational call without it reading as personal failure |
| The build team (eng) | Jobs, identity, four years of work | Strongly toward continuing | Honest redeployment / retention plan under the kill path |
| Operations / end users | A working ERP, soon, that fits their workflows | Toward whatever ships first and breaks least | Continuity of operations; migration risk owned |
| CEO / Board | Capital efficiency, strategic differentiation | Toward defensible, reversible choices | A decision that survives scrutiny and is bounded in risk |
| Off-the-shelf vendor (if chosen) | Multi-year contract | — (external) | (Counter-party — model their incentives, don’t adopt them) |
The fault line: Finance and Operations lean kill; Engineering leans continue and holds the deepest information about cost-to-complete — which is exactly the estimate most distorted by their bias. Govern that conflict explicitly (see §7).
4. The options (present, mutually exclusive set)
You framed two. A complete present-option set is usually three or four — I’m surfacing the ones that are genuinely available now, because forcing a binary is itself a decision error.
- A — Finish the rebuild. Continue funding to completion as currently scoped.
- B — Kill and switch. Stop the build, write off capitalized dev, migrate to off-the-shelf.
- C — Hybrid / harvest. Adopt off-the-shelf for the commodity core (GL, AP/AR, procurement) and keep only the genuinely-differentiated custom module(s) the rebuild produced — if such a module exists and is separable.
- D — Time-boxed finish-or-fold. Fund a bounded, ‹90-day› push against explicit completion gates; if gates miss, B executes automatically.
D is not a dodge — it’s the right answer if and only if the dominant uncertainty is “can the team actually finish from here,” because it buys information at bounded cost. If the dominant uncertainty is “is custom worth it at all,” D just delays B.
5. Criteria (the axes every option is scored on)
Weight these to your context; illustrative weights shown.
| # | Criterion | Why it matters | Illustrative weight |
|---|
| 1 | Forward cost to operational state (build/license + implementation, to go-live) | The core spend question | 25% |
| 2 | 5-yr total cost of ownership (maintenance, hosting, license renewals, internal eng) | Off-the-shelf trades capex for recurring license; custom trades license for permanent eng headcount | 20% |
| 3 | Time to operational | Every month of delay is operational cost + risk | 15% |
| 4 | Fit to differentiated workflow | The only legitimate reason custom ever wins | 15% |
| 5 | Delivery risk (P(on-time, on-spec)) | Custom’s historical weak point — and you have data on yours | 15% |
| 6 | Strategic flexibility & lock-in | Vendor lock-in vs. self-owned maintenance burden | 5% |
| 7 | Org/people impact (morale, retention, capability) | Real, but must not masquerade as criterion #4 | 5% |
Discipline: “fit to differentiated workflow” (#4) is where continuation arguments will try to smuggle in sunk cost. Test it hard: which specific workflows does off-the-shelf genuinely fail, and what is that gap worth in dollars? If you can’t name them, #4 collapses and the custom case rests almost entirely on #1–#3, where off-the-shelf usually wins.
6. Forward expected value of each path
EV here = (probability-weighted 5-yr value delivered) − (forward cost from today). Sunk cost absent by construction. Treat these as a model to populate, not as findings.
C_finish = remaining cost to complete the rebuild (apply your historical slip rate to eng’s estimate — don’t take it raw)C_license = off-the-shelf license + implementation + migration to go-liveC_maint_custom / C_maint_ots = annual run cost each (custom maintenance is a permanent eng liability; count it)T_finish / T_ots = months to operationalV_ops = monthly value of a working ERP (or monthly cost of not having one)p_finish = probability the rebuild actually reaches spec on the revised estimateGap$ = annual dollar value of any workflow off-the-shelf genuinely can’t serve
Path A — Finish the rebuild
EV_A = p_finish × [ Σ 5yr (V_ops + Gap$) − C_finish − 5×C_maint_custom − (T_finish × monthly_delay_cost) ]
     + (1 − p_finish) × [ failure value: partial system + still need OTS later ]
The (1 − p_finish) branch is the one continuation advocates omit. If the project fails again, you pay C_finish and then C_license — model that tail explicitly.
Illustrative: C_finish ‹$4M›, p_finish ‹55%› (use your slip-adjusted figure — a project 4 years in with a moving finish line rarely warrants >60%), T_finish ‹12 mo›, Gap$ ‹$0.8M/yr›, C_maint_custom ‹$1.2M/yr›.
Path B — Kill and switch
EV_B = Σ 5yr (V_ops) − C_license − 5×C_maint_ots − (T_ots × monthly_delay_cost) − Gap$_penalty
Where Gap$_penalty = the value of differentiated workflows you give up (criterion #4). The write-off of capitalized dev is an accounting event, not a forward cash cost — it does not enter EV_B (it’s the sunk cost surfacing on the P&L; firewall applies).
Illustrative: C_license ‹$3M to go-live›, T_ots ‹9 mo›, C_maint_ots ‹$0.9M/yr› (license + lighter internal team), Gap$_penalty ‹$0.8M/yr› if the custom workflows truly mattered, else ‹$0›.
Path C — Hybrid / harvest
EV_C dominates only if (a) a separable differentiated module exists, and (b) Gap$ is large enough to justify maintaining it alone. Integration cost between OTS core and the harvested module is the hidden killer — budget it generously. Often EV_C looks attractive on paper and erodes on integration reality.
Path D — Time-boxed finish-or-fold
EV_D = EV_A_conditional_on_passing_gates × p_gate
     + EV_B_delayed_by_timebox × (1 − p_gate)
     − C_timebox
D’s value = the value of information the time-box buys, minus its cost and the delay it adds to B’s start. Worth it when p_finish is uncertain (wide error bars) rather than simply low.
7. Integrating it — how to actually decide
-
Populate C_finish with a slip-adjusted, independently-reviewed estimate. Eng owns the deepest knowledge and the strongest continuation bias — so have the estimate built by eng, then stress-tested by someone with no stake in the outcome. This single number moves the decision more than any other.
-
Name the Gap$ workflows or concede #4. Force a written list: workflows off-the-shelf cannot serve, with a dollar value each. No list → criterion #4 weight goes to near-zero → off-the-shelf almost certainly wins on #1–#3.
-
Compute EV_A, EV_B, EV_C with the firewall intact. Run a sensitivity sweep on the two parameters decisions like this hinge on: p_finish and C_finish. Find the p_finish break-even — the probability of completion at which A ties B. Then ask the room honestly: given our four-year track record, is our true completion probability above or below that line? That reframing — “what would have to be true for finishing to win” — is the cleanest way to neutralize sunk-cost pressure in the room.
-
Default to D over A when uncertainty is high, to B over A when p_finish is confidently low. Never to A on the strength of the $12M.
The structural tells (before you even have the numbers)
- A project 4 years and $12M in with an open-ended finish line has, historically, a poor completion probability — the base rate alone pushes against A.
- ERP is the most commoditized enterprise software category there is. The bar for “custom beats off-the-shelf” is extraordinarily high and rests entirely on a large, real, separable
Gap$.
- The strongest voices for A hold the most sunk cost and the most reputational exposure. Weight their forward estimates accordingly, and give them an exit that isn’t framed as failure — that’s the people-criterion done right, and it’s also what makes the rational call executable.
What I need from you to turn this from architecture into a verdict
The five numbers that decide it: C_finish (slip-adjusted), p_finish, C_license, Gap$ (the named-workflows figure), and monthly_delay_cost. Give me those — even as ranges — and I’ll run the EV comparison, the p_finish break-even, and a recommendation with the sensitivity sweep behind it.
Want me to render this as a one-page decision matrix (options × weighted criteria, scored) alongside the EV model, so finance and the board get the at-a-glance and the math in one document?
Decision Architecture: ERP Strategic Pivot (Q4 Analysis)
Date: October 26, 2023
Decision Horizon: Next 24 Months
Subject: In-House ERP Rebuild (Continue) vs. Off-the-Shelf Switch (Kill/Replace)
Authorization Level: C-Suite / Board
1.0 Decision Gatekeeper: Sunk Cost Filter
Objective: Eliminate bias regarding past expenditure.
Protocol: The $12M already spent over 4 years is an historical accounting fact. It cannot be recovered.
Mathematical Rule:
$$ \text{Decision Value} = \sum (\text{Future Benefits}) - \sum (\text{Future Marginal Costs}) $$
$$ \text{Decision Value} \neq (\text{Future Costs}) + $12,000,000 $$
Constraint Explicitly Applied:
In all calculations below, the $12M initial investment is set to $0$. The cost basis starts now (today) and flows forward only.
2.0 Stakeholder & Impact Map
| Stakeholder Group | Primary Interest | Leverage/Veto Power | Concern with “Keep” | Concern with “Kill” |
|---|
| CFO | Capital Allocation & ROI | High (Budget Control) | Continued spend drains cash flow; high marginal maintenance cost. | One-time migration spike; OPEX shift to SaaS/Subscription. |
| CTO/CIO | Technical Debt & Control | Medium (Roadmap Control) | Engineering bandwidth tied; high propensy for technical obsolescence. | Migration friction; re-learning enterprise tooling. |
| COO | Operational Efficiency | High (Process Flow) | System constantly misses deadlines; internal customization is brittle. | User adoption friction; standardization vs. workflow fit. |
| Investors | Growth & Scalability | High (License/Valuation) | High CAPEX with low flexibility return. | Liquidity loss if switching impacts TTM margin. |
| End Users | Usability & Workflow | Low (Voice) | “This is difficult to use” due to custom builds drift from SaaS updates. | Change management burden; “Why change button layout?“ |
3.0 Options Definition (Forward Looking)
Note: These options describe the state of the system from Today (Q4) to Year 5.
- Option A: Extend In-House Build
- Action: Fund remaining development to complete the custom system.
- Future State: Proprietary code asset, high maintenance overhead, continuous customization to new business requirements.
- Option B: Pivot to Off-the-Shelf (OTS)
- Action: Decommission current build immediately. Select enterprise SaaS (e.g., NetSuite, Microsoft Dynamics, SAP). Execute data migration.
- Future State: SaaS Subscription, periodic migration patches, standard workflow with API integrations.
4.0 Decision Criteria (Weighted Scoring)
Criteria are ranked 1–10 (10=Best) based on strategic alignment.
| Attribute | Weight | Option A (Finish Custom) | Option B (Switch SaaS) |
|---|
| 5-Year TCO (Total Cost of Ownership) | 30% | 6/10 | 9/10 |
| Implementation Risk (Delivery Certainty) | 20% | 5/10 | 7/10 |
| Scalability & Updates | 15% | 4/10 | 10/10 |
| Market Integration Speed (Time to Feature) | 15% | 3/10 (needs dev) | 10/10 |
| Cultural Lock-In (Internal Skill Retention) | 10% | 9/10 | 5/10 |
| Time-to-Value (Status Quo Retention) | 10% | 4/10 (still in build) | 8/10 (pre-builts) |
| Weighted Score | 100% | 5.2 | 8.2 |
Interpretation: Option B wins on financial efficiency, speed, and flexibility. Option A wins solely on “Internal Skill Retention” (which is a sunk skill cost, not future value).
5.0 Forward Expected Value (EV) Calculation
Note: All figures are estimated margins based on industry benchmarks for ERP projects. Your team should replace these with actual financial forecasts.
- Sunk Cost: $12,000,000 (Removes from equation).
- Time Basis: 5 Years (2024–2028).
Path A (Finish Rebuild)
- Remaining Dev Cost (M0-M36): $6M (Est. 2 years remaining @ high burn rate).
- Annual Maintenance Support (M36-M60): $2M/year (Reqs dedicated team/team dev).
- Misc. Annual Sunk Risk: $0.5M/year (Browser/OS incompatibility risks).
- Total 5-Year Forward Cost: $13M (One-time $6M + 4 yrs $4M Maint).
- Future Benefit Valuation: Custom code usually trades for niche differentiation. Unless your competitive moat relies strictly on proprietary data, this benefit score is 0%.
- Net Present Value (NPV) @ 10%: ~-$10.5M (Assuming minimal productivity gain offsets cost).
Path B (Switch to SaaS)
- Migration Cost (M0-M12): $1.5M (Data mapping, system parallel run, training).
- SaaS Subscriptions (Years 2-5): $0.8M/year (Estimated ~10 users * $80k/month equivalent enterprise pricing).
- Internal Licensing: $500k/year (Admin/Infrastructure).
- Total 5-Year Forward Cost: $6.1M (1.5M Mig + 4yr Ops).
- Future Benefit Valuation: Productivity gains, auto-updates, improved vendor SLAs = +Estimated $1M/year value (Efficiency).
- Net Present Value (NPV) @ 10%: ~-$4.5M (Costs + Opportunity Cost Savings).
5.2 Expected Value Risk Modeling
We must account for probability of failure.
| Scenario | Path A (Finish) Risk | Path B (Switch) Risk | Probability Impact |
|---|
| SaaS Trap | N/A | Vendor locks us in; price hikes 20% | Low (Standard in industry) |
| Migration Failure | N/A | Data loss / Downtime 1 month | Medium (Occurs in 15% of projects) |
| Build Completion | Guaranteed Completion? | N/A | High (Scope creep kills 40% of custom projects) |
| Org Failure | High Team Turnover/Ship delay | Mid-level resistance to change | Medium |
Expected Value (EV) Summary (Risk-Weighted):
- Path A EV: (0.6 Cust. Success * 0) + (0.4 Failure * -12M) = -$4.8M (Forward outlook)
- Path B EV: (0.9 Success * -4.5M) + (0.1 Failure * -8M) = -$5.5M (Forward outlook)
Note: The EV for Switching (-$5.5M) is less negative than the Build EV (-$4.8M in average case due to higher risk of “Build Failure”). However, if we factor in the high probability of Build Budget Overrun (30%), Option A’s EV turns more negative.
6.0 Critical Check: The “Opportunity Cost” of the Current Build
While the $12M is not sunk, the engineering hours spent on it are a Sunk Cost Fallacy, but the engineering opportunity cost is real.
- Question: If we switch to Option B, how many Annual Engineering Years (Y) can we redirect to product innovation?
- Answer:
- Option A requires 4 FTEs to maintain/support the rebuild for 2 years, then 2 FTEs for maintenance forever.
- Option B requires 0.5 FTEs for ERP Management.
- Savings: 3.5 FTEs per year redirected to company-specific growth products.
- Value: If 1 FTE generates $200k in value annually, 3.5 FTEs = +$700k/year Forward Value.
Add to Path B Calculations:
Add $7M in Allocation Value (5Years) to Option B’s Forward SPN.
7.0 Integrated Recommendation
Verdict: Kill In-House Rebuild. Pivot to Off-the-Shelf.
The Rationale:
- Sunk Cost Irrelevance: The $12M is a datum, not a decision input. Do not spend to “justify” the past.
- Financial Dominance: The Forward Marginal Cost of completing the custom build is estimated at $13M over 5 years. The Forward Cost of the SaaS Switch is estimated at <$7M.
- Risk Profile: Custom builds have a statistically higher probability of hyperbolic cost escalation and delivery failure (Scope Creep). SaaS risks migration friction, not existential delivery failure.
- Opportunity Value: Even if users prefer to customize their new system, the Migration to a compliant enterprise platform preserves the budget for business applications, rather than infrastructure bloat.
Implementation Logic (If approved to Switch):
- Stop Work / Stop Funding: Issue a “Kill Notice” to the legacy codebase today. No new spend.
- Decommutation: Maximize preservation of data (DB dumps), not features. Partial legacy build is okay for data retrieval, not logic.
- SaaS Selection: Select a platform with API flexibility to mitigate the “Duck-Like” concern.
- Team Pivot: Repurpose the 4 retained dev FTEs to core product development immediately, not ERP maintenance.
Approval Required:
- Commit: $3M immediate migration budget (One-time).
- Forecast: $1.5M Opex per year starting Year 2.
- Audit: Post-migration Q2.
Appendix: Decision Accuracy Check
- Do not ignore the 12M? No. If the board insists on counting it, they will overestimate the margin for “Hardship” and underestimate the certainty of the new path.
- Is Switching risky? Yes, radical migration has a 15% breakthrough of operations delay. If option is “Custom” and you can guarantee budget execution, it’s safer technically, but you lose money financially.
- Recommendation relies on the belief that “Business Value > Maintenance.” If your competitive advantage is built on the ERP interface specifically, Option A is the only choice. If advantage is in how you run the business (Sales, Ops), Option B is the choice. Assumed Option B is superior.
Decision frame
Canonical Statement: Select between (1) continuing the 4-year/$12M in-house ERP rebuild or (2) terminating and switching to an off-the-shelf ERP system.
Horizon: Current quarter decision with forward impact through 3-5 years post-decision.
Sunk Cost Treatment: Historical spend ($12M) is User Parameter/Identified Sunk Cost. Forward Expected Value calculation excludes this value; decisions based on remaining completion cost vs. replacement cost.
Decision Authority: IT Steering Committee / Executive Leadership (CFO, CTO, COO, General Counsel).
Selection Criteria:
- Forward Cost (Minimize remaining expenditure).
- Implementation Time (Minimize time-to-value).
- Risk Profile (Maximize minimum cost/success likelihood).
- Stakeholder Alignment (Minimize power-asymmetry/impact).
Alternatives with probability-weighted outcomes
Alternative: Continue In-House Rebuild (A1)
Definition: Maintain current project governance/completion path; commit to remaining development scope and timeline through original finish (Year 4 of 4).
Probability-weighted outcomes:
- Remaining Cost: $5M - $8M forward estimation.
- Timeline: 12 - 24 months post-decision.
- Stabilization Period: 18 - 24 months post-implementation.
- Failure Risk: 60% (Vendor/Partner disruption; technical complexity).
- Realization Value: High potential technical control; High maintenance overhead post-decision.
Origin: User-supplied scope / [from decision-under-uncertainty]
Alternative: Switch Off-the-Shelf Pure (A2)
Definition: Terminate current rebuild; procure license + services from established enterprise vendor (e.g., SAP, Oracle, NetSuite, Infor, Microsoft); execute guided immediate migration.
Probability-weighted outcomes:
- Remaining Cost: $3.5M - $7M forward estimation (Based on licensing + implementation + migration).
- Timeline: 6 - 12 months post-decision.
- Stabilization Period: 6 - 12 months post-implementation.
- Failure Risk: 30% (Vendor adoption success; lock-in risk).
- Realization Value: Faster time-to-value; Standardized compliance; Contractual predictability.
Origin: External Verification Required / [from decision-under-uncertainty]
Alternative: Hybrid Phased Withdrawal (A3)
Definition: Exit in-house project; migrate core modules to off-the-shelf; sunset remaining in-house build; maintain workflow integration where possible with vendor terms.
Probability-weighted outcomes:
- Remaining Cost: $5.75M - $9M forward estimation (Migration + Cross-platform integration).
- Timeline: 9 - 15 months post-decision.
- Stabilization Period: 6 - 12 months post-implementation.
- Failure Risk: 45% (Vendor customization refusal; data attrition).
- Realization Value: Balance of control (CTO) and speed (CFO); Escape routes preserved.
Origin: Analyst-generated / [from decision-under-uncertainty]
Alternative: Defer-and-Monitor (A4)
Definition: Pause in-house rebuild for 6 months; evaluate third-party vendors; re-decide at quarter-end.
Probability-weighted outcomes:
- Operational Cost: Budget drain/resource split (Undefined, high variance).
- Timeline: Indefinite until evaluation complete (likely >12 months to value).
- Failure Risk: 50% (Project slippage; Market shift).
Origin: Analyst-generated boundary condition / [from decision-under-uncertainty]
Binding constraints per alternative
[Budget Cap Constraint] — applies to alternatives: [A1, A2, A3]. Mechanism of binding: CFO authority to approve >10% budget deviation. Type: Hard Binding. Binding Effect: Eliminates A1 if forward spend exceeds Fiscal Quarter Reserve. Qualifies A2/A3 if quote >$X (Threshold Unknown).
Origin: [from constraint-mapping]
[Data Migration Constraint] — applies to alternatives: [A2, A3]. Mechanism of binding: Must migrate ≥90% of historical records within <90 days of skeletal implementation. Type: Hard Binding. Binding Effect: Eliminates A2 and A3 if schema match <90% (Recoverability: Low). A1 is unaffected (no migration).
Origin: [from constraint-mapping]
[Operational Continuity Constraint] — applies to alternatives: [A2, A3]. Mechanism of binding: Zero tolerance for >72-hour system downtime during switch. Type: Hard Binding. Binding Effect: Eliminates A2/A3 if migration plan cannot fit downtime window (Risk: High). A1 unaffected.
Origin: [from constraint-mapping]
[Contract Exit Constraint] — applies to alternatives: [A2]. Mechanism of binding: Exit penalty must be ≤15% of forward projected cost (A2). Type: Contingent Binding. Binding Effect: Eliminates A2 if Exit Penalty > Threshold.
Origin: [from constraint-mapping]
[Integration Tax Constraint] — applies to alternatives: [A3]. Mechanism of binding: Legacy system integration points may add delay/cost. Type: Soft Binding. Binding Effect: Qualifies A3 (Integration complexity increases cost vs. A2).
Origin: [from constraint-mapping]
Stakeholder impact per alternative
Stakeholder: Finance (CFO)
- Alternative A1: Negative Impact (High Capital Commitment). Reason: CFO loses leverage on debt/budget allocation.
- Alternative A2: Positive Impact (Medium). Reason: Faster ROI; Predictable CapEx vs OpEx shift.
- Alternative A3: Positive Impact (Medium). Reason: Controlled disruption; Time-shifted value.
- Alternative A4: Positive Impact (Low/Medium). Reason: Preserves options but commits time.
Stakeholder: Engineering (CTO/Dev Leads)
- Alternative A1: Neutral/Strong Impact (Positive Context). Reason: Technical continuity; Team stability.
- Alternative A2: Negative Impact (Strong). Reason: Engineering craft devaluation; Team displacement.
- Alternative A3: Positive Impact (Medium). Reason: Modular migration work; Preserves some control.
- Power-Asymmetry: CTO influence on technical choice is high for A1/A3; lower for A2.
Stakeholder: Operations (End Users)
- Alternative A1: Negative Impact (Strong). Reason: Long delay to benefits; Continued manual processes.
- Alternative A2: Positive Impact (Medium). Reason: Standardization; Speed.
- Alternative A3: Positive Impact (Medium). Reason: Buffered transition; Minimal disruption.
- Power-Asymmetry: End users cannot influence system choice; Impact is deterministic based on decision.
Stakeholder: Compliance/Legal
- Alternative A1: Neutral Impact. Reason: Familiar structure; Audit trail continuity.
- Alternative A2: Positive Impact. Reason: SaaS standardization terms; Regulatory compliance mapped to vendor guarantees.
- Alternative A3: Positive Impact. Reason: Hybrid contract structure reduces single-vendor reliance risk.
Stakeholder: IT Operations
- Alternative A1: Positive Impact. Reason: Existing team skill set continuity.
- Alternative A2: Negative Impact. Reason: Requires significant upskilling on new toolset.
- Alternative A3: Positive Impact. Reason: Retention of existing EC architecture with maintenance workstream.
Synthesis Note: A3 resolves the conflict between Finance (A2) and Engineering (A1) by offering a route that allows migration with managed technical debt, though it lags A2 on pure cost velocity.
Origin: [from stakeholder-mapping]
Failure pathways for the leading alternative(s)
[Alternative A1 — Key Developer Attrition] — Scenario: By Month 12 of development, senior architects resign.
Consequence: Project stalls 6 months; Technical Debt incurred prevents migration.
Leading Indicators: Staff turnover rates; Code quality metrics.
Recoverability: Low (Rebuild required; Sunk Cost increases).
Origin: [from pre-mortem-action]
[Alternative A1 — Customization Creep] — Scenario: Initial “light touch” add-ons expand to full-suite migrations.
Consequence: Technical complexity bottlenecks resources; Cost exceeds threshold ($5M+).
Leading Indicators: Dev budget burn rate; Ticket count.
Recoverability: Low (Unable to Revert; Cost Sunk).
Origin: [from pre-mortem-action]
[Alternative A3 — Vendor Integration Refusal] — Scenario: Vendor commits to standard module but refuses customization integration.
Consequence: SaaS cannot support workflow; Migration cost/time 2-3x increase.
Leading Indicators: Vendor contract SLA terms; API slave documentation.
Recoverability: High (Revert to A2 or A1).
Origin: [from pre-mortem-action]
[Alternative A3 — Data Quality Attrition] — Scenario: Source ERP prevents clean migration; >10% data validation failure.
Consequence: Extended cleansing timeline (60% re-engineering).
Leading Indicators: Pre-migration audit score <80%.
Recoverability: Medium (Delay Cutover by 90 days; Cost Penalty +$2M).
Origin: [from pre-mortem-action]
[Alternative A2 — Operational Burn-Through] — Scenario: End-user adoption <60% by Month 6 (Productivity dip).
Consequence: Help Desk spikes; Freeze on adoption.
Leading Indicators: Training completion rates <85%.
Recoverability: Medium (Extended training budget; +$1M).
Origin: [from pre-mortem-action]
Recommended alternative with residual risks
Recommended: Alternative A3 (Hybrid Phased Withdrawal).
Integrated Rationale:
- Risk Integration: A3 resolves the Engineering-Sustainability (CTO) vs. Cost (CFO) tension better than A2.
- Recovery: Failure Pathways for A3 are “recoverable” (can revert to A2) whereas A1/A2 paths are often “unrecoverable” (locking in technical debt or lock-in).
- Sunk Cost Fallacy: Explicit decision to exclude $12M sunk history aligns with A3 strategy (partial makes cost harder to define, but hybrid business case is clearer).
Residual Risks (What A3 does NOT eliminate):
- Vendor Lock-in: 30% risk (Exit clauses unknown).
- Data Migration Attrition: ±$2M variance (Validation unverified).
- Insider Exit/Attrition: Market conditions may force A3 into A2 (Budget expiry).
- CFO Pressure: Financial discipline may override Hybrid plan.
Recommendation Confidence: Low-Medium.
Origin: [from pre-mortem-action] / [from constraint-mapping]
Decision conditions to monitor
Condition: Vendor Quote Confirmation
Observable Signal: Quoted Vendor Implementation Cost.
Trigger Action: If ≥$5M → Re-classify to A1 (In-House) or Deferred Decision.
Signal Latency: 1-2 weeks.
Origin: [from decision-conditions-protocol]
Condition: Migration Readiness Score
Observable Signal: Schema Audit/Validation %.
Trigger Action: Delay Cutover; Activate A4 (Defer) or A1 data-specific mitigation.
Signal Latency: 1-4 weeks.
Origin: [from decision-conditions-protocol]
Condition: Exit Penalty Review
Observable Signal: Legal Contract Review (Exit Fees).
Trigger Action: If >15% → Reassess A2 viability; May shift to A3/A1.
Signal Latency: 7 Days (Decision Month 0).
Origin: [from decision-conditions-protocol]
Condition: Timeline Slip Rate
Observable Signal: Budget Burn vs. Quarterly Goal.
Trigger Action: Activate A4 (Defer) strategy if decision signal lag >90 Days.
Origin: [from decision-conditions-protocol]
Confidence map
Layer: Component Stage (EV Estimates)
Confidence: Medium
Reasoning: “Absent vendor quotes” (Unretrieved); Industry bands used.
Origin: [from confidence-calibration-protocol]
Layer: Component Stage (Constraint Binding)
Confidence: Medium
Reasoning: “Verification required” (User Parameter); Data constraint verified.
Origin: [from confidence-calibration-protocol]
Layer: Component Stage (Stakeholder Map)
Confidence: Medium
Reasoning: “Assumed composition” (No data provided); Role-based inference.
Origin: [from confidence-calibration-protocol]
Layer: Component Stage (Pre-Morthe)
Confidence: Medium
Reasoning: “Scenario Construction”; Recoverability inferred.
Origin: [from confidence-calibration-protocol]
Layer: Synthesis Stage (Recommendation)
Confidence: Low-Medium
Reasoning: “Confidence bleeding” (EV Low-Medium → Rec Low-Medium).
Origin: [from confidence-calibration-protocol]
Coverage Gap Residuals:
- Claim: “$12M Sunk Cost” —
User Parameter: Confirmed policy, not ledger fact.
- Claim: “$5M Threshold” —
External Dispute: Verified as “Enterprise Tier” (Not universal).
- Claim: “90% Schema Match” —
Operational Assumption: Requires Engineering Council Review.
Origin: [from confidence-calibration-protocol]
Decision frame
Decision being architected: Determine the strategic path for the enterprise resource planning (ERP) initiative this quarter, choosing between continuing the in-house rebuild or terminating it to adopt a commercial off-the-shelf (OTS) system.
Time Horizon: 36 to 60 months (forward-looking value realization and total cost of ownership).
Decision Authority: Executive Steering Committee (Board/Capital Committee, CFO, CIO, COO).
Sunk vs. Forward Boundary: Approximately $8M–$12M already spent over four years is strictly excluded from all forward expected value (EV) calculations. Only remaining completion costs, migration overhead, and future operational value are in scope.
Alternatives with probability-weighted outcomes
Alternative: A1: Continue to Completion (In-House)
- Probability-weighted outcomes: [from decision-under-uncertainty] 40% probability of on-time completion delivering exact workflow match (+$10M net value); 35–60% probability of 6–12+ month delay with scope creep and +$2M–$4M emergency funding (+$2M to +$6M net value); 10–15% probability of unreliable delivery or abandonment (–$2M to –$11M net value).
- Origin: user-supplied
- Forward EV: +$2.2M to +$4.7M (variance reflects different proxy assumptions for remaining completion costs).
Alternative: A2: Kill & Switch to OTS
- Probability-weighted outcomes: [from decision-under-uncertainty] 60–70% probability of smooth migration live in 9 months delivering expected value (+$5.5M to +$13M net value, inclusive of ~$4.5M–$12M 5-year forward TCO); 25–30% probability of deployment delays, partial success, or remediation consulting (+$6M or –$2M net value); 5–10% probability of outright failure or severe disruption (–$2M to –$10M net value).
- Origin: user-supplied
- Forward EV: +$3.25M to +$8.6M (variance reflects differing assumptions on 5-year SaaS licensing vs. short-term net value horizons).
Alternative: A3: Hybridize / Cap and Salvage
- Probability-weighted outcomes: [from decision-under-uncertainty] 35–80% probability of solving immediate bottlenecks (+$2M to +$2.4M net value); 20–65% probability of brittle integration, dual-system maintenance burden, or eventual forced full migration later (–$3M to –$15M net value). Includes a “Future Tail” disclosure: the 36-month EV horizon captures immediate patch value, but implies a deferred, premium-priced full migration cost in Months 24–36.
- Origin: analyst-generated
- Forward EV: –$3.9M to +$1.52M.
Alternative: A4: Phased Migration / Stabilize then Migrate
- Probability-weighted outcomes: [from decision-under-uncertainty] 50% probability pilot proves out and full migration succeeds (+$3M net value); 25–50% probability pilot exposes gaps leading to delayed success or emergency migration under duress (–$3M to –$12M net value).
- Origin: analyst-generated
- Forward EV: –$2.0M.
Binding constraints per alternative
- OTS Feature Coverage [from constraint-mapping] — applies to alternatives: A2, A4. Mechanism of binding: Hard, contingent. Eliminates: Eliminates A2 and A4 if OTS cannot cover the tier-1 differentiating workflows without heavy customization.
- Data Schema Asymmetry [from constraint-mapping] — applies to alternatives: A2. Mechanism of binding: Soft / contingent. Eliminates: None outright, but if >30% of legacy logic cannot be mapped to standard OTS modules, the 9-month timeline collapses, pushing the project into the “Severe Disruption” probability band.
- In-House Talent Retention [from constraint-mapping] — applies to alternatives: A1, A2. Mechanism of binding: Soft / hard. Eliminates: Invalidates A1’s forward cost estimate if specific legacy architects depart before completion; under A2, their departure severely degrades implementation success probability.
- Board Capital Appetite [from constraint-mapping] — applies to alternatives: A1. Mechanism of binding: Soft, contingent. Eliminates: Eliminates A1 if a hard mandate for no further in-house IT capital is enacted. A soft cap downgrades it.
- Time-to-Value [from constraint-mapping] — applies to alternatives: A1, A2, A4. Mechanism of binding: Hard, contingent. Eliminates: Qualifies alternatives; if operational pain requires a working system within 12 months, only A1 can deliver full value. A4 can deliver partial time-to-value faster than A2 for specific modules via early pilot cutovers, reordering success-case preferences for that subset.
Stakeholder impact per alternative
| Stakeholder | Alternative | Impact Direction | Magnitude | Power-Asymmetry Note |
|---|
| Board / Investors | A1 | Negative | High | Power: High. Carries highly negative perception (“throwing good money after bad”) and future write-down risk. |
| A2 | Negative (short-term) / Positive (long-term) | High | Power: High. Requires absorbing an immediate $8M–$12M impairment charge this quarter, but presents a bounded, credible path to stability. |
| A3 | Neutral / Negative | Moderate | Power: High. Presents pragmatic but underwhelming band-aids. |
| A4 | Neutral / Negative | Moderate | Power: High. Presents pragmatic but underwhelming band-aids. |
| CIO / IT Leadership | A1 | Mixed | High | Power: High. Offers high internal prestige if successful, but career-limiting risk if failed. |
| A2 | Mixed | High | Power: High. A career-defining migration with a short-term reputational hit but long-term maintenance relief. |
| A3 | Negative | High | Power: High. Carries the highest political and integration complexity risk. |
| A4 | Positive / Moderate | High | Power: High. Managed transition with phased risk. |
| In-House Engineering / Dev Team | A1 | Positive (security) / Negative (burnout) | High | Power: Low; bears disproportionate negative impact under B/C/D, creating a structural power asymmetry and retention risk. Maintains job security but carries high burnout risk. |
| A2 | Negative | High | Power: Low; bears disproportionate negative impact under B, creating a structural power asymmetry and retention risk. Severe negative impact: high risk of role redundancy, reassignment, or departure. |
| A3 | Negative | High | Power: Low; involves role redefinition and transition to stabilization support. |
| A4 | Negative | High | Power: Low; involves role redefinition and transition to stabilization support. |
| End Users (Ops/Finance/Clients) | A1 | Negative | High | Power: Medium; bears impact but cannot dictate architecture. Continues operational friction, manual workarounds, and billing/invoicing error risks. |
| A2 | Mixed | High | Power: Medium; bears impact but cannot dictate architecture. Delivers short-term cutover pain (parallel-system chaos) followed by rapid workflow improvement and portal reliability. |
| A3 | Negative | Moderate | Power: Medium; continues operational friction and patch maintenance. |
| A4 | Positive (gradual) | Moderate | Power: Medium; offers gradual transition with less peak disruption. |
Provenance: [from stakeholder-mapping]
Failure pathways for the leading alternative(s)
-
The implementation failed to deliver core financial reporting, causing Finance to revert to shadow IT and negating projected value realization due to late-discovered customization debt — causal pathway: Project team accepted optimistic vendor timelines without deep data discovery → Month 3 reveals unique billing logic does not map to standard APIs → Leadership forces the software to fit, turning the OTS into a thinly disguised, heavily customized system with vendor lock-in. Leading indicators: >15% of critical billing records fail validation in Month 2 data mapping; >30% of business-critical workflows require custom code during the 90-day mapping phase. Recoverability: Unrecoverable — reason: The OTS advantage is lost while absorbing both the write-off and customization tax. [from pre-mortem-action]
-
The in-house rebuild team resigned or mentally disengaged, taking undocumented business logic with them, leaving the OTS implementation team lacking the context to configure correctly — causal pathway: Team anticipates migration and disengages → Institutional knowledge flight → OTS team lacks context to configure. Leading indicators: Voluntary attrition rate of rebuild team exceeds 10–15% within 60 days of the decision; ≥1 Tier-1 architect resignation triangulated with indirect observables (sudden spike in recruiter InMails, unexplained absences from core code reviews). Recoverability: Recoverable — reason: Expensive to fix if caught pre-cutover via emergency retention bonuses; very expensive post-cutover. [from pre-mortem-action]
-
The legacy system was decommissioned too aggressively, causing data integrity, integration breaks, or audit-trail gaps to surface — causal pathway: Aggressive decommissioning → Data integrity, integration breaks, or audit-trail gaps surface in parallel run. Leading indicators: Parallel-run error rate in any tier-1 system exceeds 0.5% in the first month; >5 new, unapproved departmental spreadsheet macros created post-cutover. Recoverability: Recoverable — reason: Requires halting cutover to re-stabilize; depends on affected systems. [from pre-mortem-action]
-
The Board lost patience at the 12-month mark and force-completed the migration prematurely after already absorbing the sunk cost write-off — causal pathway: Migration takes longer than projected → Board loses patience at 12-month mark → Force-completes the migration prematurely. Leading indicators: Two consecutive board meetings where discussion framing shifts from “status updates” to “do we stop this.” Recoverability: Recoverable — reason: If preemptively governed via a pre-committed 9-month decision checkpoint with explicit go/no-go criteria. [from pre-mortem-action]
Recommended alternative with residual risks
Recommended: A2 (Modified Kill & Switch, De-Risked) — integrated rationale: Proceed strictly conditional on a 30-to-90-day “Feature-Coverage and Data Audit” phase. This integrates financial EV (A2 leads the forward value), binds the OTS Feature Coverage constraint (audit acts as the contingent go/no-go gate), addresses stakeholder asymmetry (mandates a 7-day retention/transition package to neutralize Institutional Knowledge Flight), and operationalizes the pre-mortem (front-loading change management and parallel-run discipline to prevent Shadow IT reversion). If the audit confirms >90% of tier-1 workflows can be configured in OTS without custom code, execute the full migration. If the audit reveals >30% customization debt or critical feature gaps, pivot immediately to Alternative C or D to salvage near-term value while designing a longer-term architecture.
Residual risks that survive the recommendation:
- Immediate Financial Impairment: The Board must absorb the $8M–$12M sunk cost write-off this quarter. This recommendation provides no shield against that financial reality.
- Personnel Departure & Trust Erosion: A retention package does not guarantee the retention of 1–2 key IT personnel emotionally invested in the in-house build. Trust repair is a 12–24-month process.
- Transient Productivity Dip: A 10–15% drop in operational throughput during the 3-month cutover and parallel-run period remains unavoidable and is priced into the risk model.
- Structural Vendor Lock-in: The organization trades institutional knowledge lock-in for 5–10 years of OTS vendor pricing power and roadmap dependency.
- Strategic Feature Gap: Even with current OTS coverage, the rebuild’s purpose may have been to serve a future differentiating need that OTS will not match in time.
What this recommendation does NOT eliminate: The sunk cost itself, the inherent friction of changing established enterprise workflows, or the loss of proprietary custom logic if it definitively cannot be mapped to the commercial platform.
Decision conditions to monitor
- Data migration validation error rate / Feature coverage gap — observable signal: >15% of core transactional records require manual mapping, or >30% of tier-1 workflows require custom code. Monitors: Alternative A2 viability. Trigger: Pivot to Alternative A3 or A4. Signal latency: 2 weeks to 3 months post-discovery start.
- Pre-signature vendor reference validation — observable signal: 3 vendor-provided customer references in the exact same industry with similar custom-workflow profiles, validated by internal technical lead without escalation flags. Monitors: Alternative A2 vendor capability. Trigger: Halted procurement if references fail. Signal latency: 0–3 months (Procurement gate prior to contract signature).
- Voluntary resignation / attrition of Tier-1 IT Architects and rebuild team — observable signal: ≥1 tendered resignation, triangulated with indirect observables (recruiter InMail spikes, unexplained absences from core code reviews, declining calendar attendance), or >10% team attrition within 90 days. Monitors: Pathway 2 failure risk. Trigger: Immediate retention severance or mandatory knowledge-transfer protocol. Signal latency: Immediate (0 weeks) to 3 months.
- Parallel-run integrity metric — observable signal: Error rate in any tier-1 system exceeding 0.5% (target is <0.5% for 30 consecutive days). Monitors: Pathway 3 failure risk. Trigger: Emergency halt and re-stabilization. Signal latency: 3–6 months into parallel run.
- Shadow IT proliferation — observable signal: >5 new, unapproved departmental spreadsheet macros created post-cutover. Monitors: User adoption and Pathway 3. Trigger: Emergency change-management intervention. Signal latency: 4 weeks post-go-live.
- Forward cost variance — observable signal: Forward 5-year cost running <20% ahead of the mid-case estimate. Monitors: Alternative A2 financial execution. Trigger: Scope reassessment. Signal latency: 12 months.
Confidence map
- Component-Stage Atoms (Financial Proxies & EV): Medium to Low Confidence. Forward EV calculations rely on Phase A proxy assumptions for remaining build costs, OTS implementation fees, and unprovided internal ledger figures. Exact completion percentage of the current in-house rebuild is an unresolved load-bearing unknown that materially shifts the EV delta between A1 and A2.
- Component-Stage Atoms (Stakeholder & Constraint Logic): High Confidence. Based on corroborated, well-documented industry patterns of custom vs. SaaS ERP migrations (data mapping complexity, change management friction, power asymmetries).
- Synthesis-Stage Atoms (Integration & Tension Surfacing): Medium Confidence. The integrated recommendation combines proxy-based financial estimates (Medium/Low) with structural assumptions about the data-schema constraint, bounding synthesis confidence lower than the highest component-stage atoms.
- Synthesis-Stage Atoms (Monitoring Conditions & Residual Risks): High Confidence. Concrete signals, thresholds, latencies, and standard ERP-migration risks are explicitly specified and comprehensive.
1. Decision frame
Decision being architected: Continue funding the in-house ERP rebuild (4 years in, $12M cumulative spend) OR terminate it and adopt a commercial off-the-shelf (COTS) platform. Scope: Immediate decision required this quarter, with a 24–36 month forward financial modeling horizon and a 3–5-year ROI realization window. Decision authority: Executive Steering Committee — Board/CEO with CFO recommendation/countersignature, and CIO accountable for execution. Binding constraint: Sunk-cost discipline is strictly enforced. The $12M cumulative spend is reported for historical context only and is explicitly excluded from every forward-looking NPV, ROI, or Expected Value (EV) calculation. Forward modeling compares only the cost to finish the in-house rebuild against the cost to implement the COTS system moving forward.
2. Alternatives with probability-weighted outcomes
Alternative: Option A — Continue (Full Commitment). Fund the rebuild to original scope to completion.
Probability-weighted outcomes: P(launch meets scope/time/budget) = 30–50% (band anchored to industry failure rates for troubled in-house rebuilds at year 4). Forward EV skew is highly negative due to compounded technical debt, scope creep, and delayed time-to-value. Strategic caveat: This probability band assumes the in-house system replaces commodity ERP functionality. If the rebuild pursues genuine competitive differentiation no COTS vendor covers, Option A’s EV rises materially. [from decision-under-uncertainty]
Origin: User-supplied
Alternative: Option B — Kill and Switch (COTS). Terminate in-house immediately; procure, configure, and deploy a commercial platform.
Probability-weighted outcomes: P(success) = 60–80% (COTS base rate), strictly contingent on deployment methodology. Forward EV is moderately positive (faster time-to-value, predictable licensing) but turns sharply negative under a “Big Bang” cutover due to operational-paralysis risk. [from decision-under-uncertainty]
Origin: User-supplied
Alternative: Option C — Phased Hybrid (Selective Salvage). Retain in-house modules with demonstrable standalone value; switch the remainder to COTS.
Probability-weighted outcomes: P(success) = 70–85% (lower Big Bang exposure). Forward EV wins over B only if the salvage value of retained in-house modules exceeds the integration-cost penalty. [from decision-under-uncertainty]
Origin: Analyst-generated
Alternative: Option D — Hard-Gate Defer / Funded Pause. Freeze all new in-house development spend immediately; fund a strict 90-day parallel discovery/RFP phase with explicit go/no-go criteria to validate COTS fit and forward costs before committing.
Probability-weighted outcomes: Forward cost is low and defined. This is a decision-quality gate, not a terminal operational state. Conditional terminal routing yields an ~85%+ probability of a clean go/no-go decision matrix. If it validates COTS, EV mirrors B; if it validates Continue, EV mirrors A; if it aborts both, EV is the bounded cost of the RFP while successfully avoiding multi-year capital bleed. [from decision-under-uncertainty]
Origin: Analyst-generated
3. Binding constraints per alternative
[Capital availability (next 12 mo.)] — applies to alternatives: A, B, C, D. Mechanism of binding: Hard for A and B; soft for C and D. Eliminates: None outright, but severely qualifies A and B if capital is constrained, as they require significant upfront or sustained burn. [from constraint-mapping]
[In-house team retention] — applies to alternatives: A, B, C, D. Mechanism of binding: Soft → Hard if triggered. Eliminates: B’s viability if key developers depart prematurely (knowledge loss invalidates A’s forward timeline as well); favors A, C, D. [from constraint-mapping]
[Data migration feasibility / complexity] — applies to alternatives: B, C. Mechanism of binding: Hard (contingent). Eliminates: B or C if mapping variance exceeds tolerance during piloting, causing timeline/budget collapse. [from constraint-mapping]
[Operational continuity (cannot stop the business)] — applies to alternatives: B (primarily). Mechanism of binding: Hard. Eliminates: The “Big Bang” cutover sub-path of Option B as a viable execution strategy. [from constraint-mapping]
[Customization wall] — applies to alternatives: A, C. Mechanism of binding: Hard if triggered. Eliminates: A’s financial viability if vendor updates break bespoke functionality and maintenance structurally exceeds replacement cost; qualifies C’s integration pathway. [from constraint-mapping]
[Technical debt ceiling] — applies to alternatives: A. Mechanism of binding: Contingent. Eliminates: A if legacy codebase past replacement threshold makes maintenance cost exceed replacement cost (Maintenance Crossover). [from constraint-mapping]
[Vendor lock-in (post-switch)] — applies to alternatives: B, C. Mechanism of binding: Soft. Eliminates: None, but qualifies and constrains future flexibility based on COTS vendor roadmap/pricing. [from constraint-mapping]
[Regulatory / compliance continuity] — applies to alternatives: A, B, C, D. Mechanism of binding: Hard. Eliminates: Any path failing to maintain compliance boundaries during cutover or transition. [from constraint-mapping]
[“This quarter” decision timeline] — applies to alternatives: A, B, C, D. Mechanism of binding: Hard. Eliminates: C and D if executive impatience reads a 90-day pause as indecision and demands an immediate binary choice, forcing a premature A-vs-B decision. [from constraint-mapping]
4. Stakeholder impact per alternative
| Stakeholder | Alternative | Impact Direction | Magnitude | Power-Asymmetry Note | Provenance |
|---|
| Board / CEO / Shareholders | A | Negative | High | Poor governance optics of persisting with a failing $12M project. | [from stakeholder-mapping] |
| B | Positive | Moderate | Decisive reset, CapEx→OpEx, cleaner optics; carries disclosure risk if cutover fails. | [from stakeholder-mapping] |
| C | Neutral-Positive | Mixed | Demonstrates disciplined capital allocation. | [from stakeholder-mapping] |
| D | Positive | Moderate | Demonstrates discipline; defers ultimate accountability. Relies on filtered reporting. | [from stakeholder-mapping] |
| CFO / Finance | A | Negative | High | Unpredictable CapEx bleed, write-off risk. | [from stakeholder-mapping] |
| B | Positive | High | Predictable OpEx, balance-sheet optimization, defined budget. Dictates CapEx/OpEx boundary but does not bear workflow friction. | [from stakeholder-mapping] |
| C | Positive | Moderate | Caps immediate bleed, enables precise budgeting. | [from stakeholder-mapping] |
| D | Positive | Moderate | Preserves capital. | [from stakeholder-mapping] |
| CIO / IT & in-house ERP team | A | Positive | High | Retains control, validates past effort. Can veto/delay but does not bear CapEx-overrun penalty. | [from stakeholder-mapping] |
| B | Negative (short-term) / Positive (long-term) | High | Loss of control, perceived failure; team likely terminated/transitioned (high human cost). Reduced long-term maintenance. | [from stakeholder-mapping] |
| C | Positive | Moderate | Retained for chosen modules; career depends on integration skill. | [from stakeholder-mapping] |
| D | Positive | Moderate | Buys time to restructure team or make a clean case. | [from stakeholder-mapping] |
| End users / Operations | A | Negative | High | Prolonged exposure to deficient system. Bears severe day-to-day impact but holds no Steering Committee vote. | [from stakeholder-mapping] |
| B | Negative (short) / Positive (long) | Moderate / High | Short-term cutover/retraining disruption; long-term modern UX. Negative impact structurally overridden unless mitigated via change management. | [from stakeholder-mapping] |
| C | Neutral-Mixed | Moderate | Mixed transition experience. | [from stakeholder-mapping] |
| D | Neutral | Low | Status quo, delays both pain and gain. | [from stakeholder-mapping] |
| Customers | A | Negative | Low | Indirect drag from aging platform. Bears impact, no vote. | [from stakeholder-mapping] |
| B | Negative (short) / Positive (long) | Low | Brief disruption risk during cutover. | [from stakeholder-mapping] |
| C | Neutral-Mixed | Low | Mixed transition experience. | [from stakeholder-mapping] |
| D | Negative | Low | Indirect drag continues. | [from stakeholder-mapping] |
| SI / implementation partner | A | Negative | Low | Reduced role. | [from stakeholder-mapping] |
| B | Positive | High | Wins full implementation scope. | [from stakeholder-mapping] |
| C | Positive | Moderate | Wins portion of implementation scope. | [from stakeholder-mapping] |
| D | Neutral | Low | Modest role during assessment. | [from stakeholder-mapping] |
| Audit / Compliance | A, B, C, D | Neutral | Low | Adequate, provided continuity constraints are met. | [from stakeholder-mapping] |
5. Failure pathways for the leading alternative(s)
-
Month 9–18: the migration failed. — causal pathway: complexity of migrating 4 years of bespoke in-house data into rigid COTS schema was underestimated → aggressive go-live date drove a “Big Bang” weekend cutover → data mappings failed, extended downtime followed (> $8,200/hr), frustrated end-users reverted to shadow-IT spreadsheets, vendor blamed “poor data hygiene,” triggering costly remediation. Leading indicators: data mapping variance >10% during pilot (2–4 wks pre-cutover); cutover dry-run reconciliation errors >0.5% of historical records; post-cutover order-processing failure >1% in week 1; help-desk volume >2× baseline within 30 days; vendor/PM pushing Big Bang over phased; key stakeholders refusing to sign off on process re-engineering. Recoverability: Moderate — re-implementation, extended dual-running, or partial module rebuild are possible; capital write-off bounded, but operational write-off (lost sales, customer trust) less bounded. Recoverability rises to High only if parallel deployment is enforced; falls to Low under Big Bang. [from pre-mortem-action]
-
Month 18: the hybrid is failing. — causal pathway: integration cost between retained in-house and new COTS modules was systematically underestimated → two-system operation costs more than the savings → retained modules are the most customized (requiring near-full in-house team cost with poor morale) → COTS modules are customized to match in-house data contracts, recreating the customization wall → phase cutovers slip quarter-by-quarter. Leading indicators: integration cost variance >20% over budget by month 6; two-system operating cost >15% over budget by month 9; in-house attrition >10% in 6 months; >30% of delivered COTS modules requiring bespoke code; rolling cutover slip >1 quarter behind at any gate. Recoverability: Low — once the integration-cost trap engages, recovery means either accepting the half-state or cutting fully to COTS and writing off the retained in-house investment (the sunk-cost trap re-engages). [from pre-mortem-action]
-
Month 12: continuing is failing. — causal pathway: the 4-year/$12M position becomes 5-year/$X, then 6-year/$Y → the rebuild’s annual maintenance + emergency-patch budget exceeds a COTS run-rate (Maintenance Crossover triggered) → every vendor library update needs a compatibility assessment → team morale degrades → forced recovery becomes kill + COTS, but with a depleted team and worse optionality than at the original decision point. Leading indicators: maintenance spend ≥1.2× COTS run-rate; vendor-update compatibility assessment >1 sprint per update; in-house attrition >15% in 6 months; >2 scope re-cut requests in any 6-month window; original go-live slip >1 quarter. Recoverability: Worst of the three — the load-bearing reason pure Option A is rejected. [from pre-mortem-action]
6. Recommended alternative with residual risks
Recommended: Option D (Hard-Gate Defer / Funded Pause) with an immediate, binding transition to Option B (COTS) or Option C (Phased Hybrid) contingent on a 6-week module-level assessment.
Integrated rationale: This recommendation synthesizes the conflict between the probability-weighted financial favorite (Option B) and the salvage-value optimization (Option C). Both integration paths reject pure Option A due to its poor recoverability and negative forward EV. The immediate execution of Option D (a hard freeze on new in-house scope plus a funded 90-day/6-week RFP and module assessment) resolves the “this quarter” timeline constraint by taking immediate, low-cost action while generating the specific empirical data required to choose between B and C. If the assessment finds fewer than two in-house modules with standalone value COTS cannot match, the path defaults to Option B. If ≥2 modules are salvageable, Option C is pursued. Crucially, if Option B is chosen, the recommendation mandates a phased/parallel deployment methodology, structurally eliminating the “Big Bang” cutover to protect against operational paralysis.
Residual risks that survive the recommendation:
- Integration-complexity / customization-wall risk (accepted as the lowest-bad outcome under a Phased Hybrid).
- Vendor lock-in, constraining future customization to the COTS vendor’s roadmap and pricing power.
- Change-management fatigue and stakeholder blowback, particularly from the in-house team and CIO whose institutional interests align with Option A.
- Timeline incompatibility: If a binding terminal decision is forced in ≤90 days, the 6-week assessment window may be overridden by executive impatience, forcing a premature A-vs-B binary choice.
What this recommendation does NOT eliminate:
- The fundamental uncertainty of forward cost estimates, as exact internal dollar timelines to complete Option A or implement Option B are not yet available.
- The risk that up to 10–15% of highly bespoke legacy workflows will lack a direct COTS equivalent, requiring permanent manual workarounds.
- The structural information asymmetry between the Steering Committee and ground-level implementation risk; this analytical recommendation is not a substitute for sound decision-process safeguards (e.g., external advisors or second-opinion gates to mitigate internal bias).
- The reverse sunk-cost tax: salvaging in-house modules may still incur integration complexity, requiring strict discipline to value the capability the $12M produced on its own merits, not the historical spend.
7. Decision conditions to monitor
- Module-assessment completion — observable signal: No definitive go/no-go verdict issued. Monitors: Option D / overall roadmap. Trigger: Auto-escalate to Option B; do not extend the Defer phase indefinitely. Signal latency: 6 weeks.
- Data-mapping integrity — observable signal: >10% record mismatch or manual intervention required during pilot/parallel run. Monitors: Option B and Option C data migration constraint. Trigger: Halt vendor selection/parallel progression; return to assessment framework for a dedicated data-remediation plan before cutover. Signal latency: 2 weeks post-pilot.
- In-house rebuild sustaining spend (Maintenance Crossover) — observable signal: Legacy maintenance and emergency-patch spend exceeds COTS run-rate by ≥20% (≥1.2× multiplier). Monitors: Option A viability (and latent risk to B/C if transition is delayed). Trigger: Accelerate cutover; do not extend rebuild. Signal latency: 3 months.
- In-house team voluntary attrition — observable signal: >15% annualized attrition among key personnel. Monitors: Option A, B, and C (talent retention constraint). Trigger: Emergency knowledge-transfer + third-party stabilization; accelerate transition to B to prevent total capability loss. Signal latency: 1 month (decision) / 2–3 months (rolling).
- COTS integration cost variance — observable signal: Live integration costs exceed plan by >25% by month 6 of cutover. Monitors: Option C execution. Trigger: Stop customization; accept COTS standard; re-baseline; re-route remaining functions to B as a salvage path. Signal latency: 3 months.
- Operational disruption during cutover — observable signal: >4 hours cumulative unplanned downtime during a parallel run, or >24 hours unplanned downtime during an active cutover. Monitors: Option B and Option C execution. Trigger: Activate dual-system runbook; revert legacy for affected function; invoke Statement of Work (SOW) penalty clauses; convene emergency Steering Committee viability review. Signal latency: Real-time / daily.
- Rolling cutover slip — observable signal: Milestone delivery slips by >1 quarter behind at any gate. Monitors: Option C execution. Trigger: Re-open alternative evaluation; do not allow the slip to compound. Signal latency: 1–3 months.
8. Confidence map
- Exclusion of $12M sunk cost: High confidence. Based on standard accounting principles and explicitly mandated by the decision frame.
- Big Bang ERP failure rate (50–70%): Medium-High confidence. Corroborated by multiple industry sources specifically tied to the Big Bang methodology.
- General ERP implementation failure rate (60–70%+): Medium-High confidence. Corroborated by industry studies (e.g., Jobin and Jismi, Pemeco).
- Operational downtime cost (~$8.2K/hr / £41K/day): Medium confidence. Represents industry-banded averages; firm-specific multipliers are unknown and require internal calculation.
- Data-loss tail risk (40% never recover; 90% of >10-day-downtime firms bankrupt within a year): Medium confidence. Corroborates tail risk, though the precise threshold is >10 days of downtime, not general short outages.
- Probability bands for alternatives (30–50% / 60–80% / 70–85%): Medium confidence. Anchored to industry base rates and logical inference, but precise internal calibration remains opaque without internal historical data or a formal risk-assessment workshop.
- Per-alternative stakeholder impacts & power asymmetries: Medium confidence. Structurally sound based on standard governance dynamics, but depends on the actual, confirmed composition and behavior of the specific Executive Steering Committee.
- Recommendation (Option D transitioning to B or C): Lower confidence than component-stage atoms. This synthesis-stage conclusion depends entirely on internal inputs not supplied in the current context (e.g., actual forward cost estimates, % complete of rebuild, current sustaining spend).
- Monitoring thresholds (e.g., 10%, 15%, 4-hr, 24-hr, 20%, 25%): Medium confidence. These are prescribed as internal governance triggers for action, not universal industry benchmarks, and require calibration to the specific organizational environment.
- Residual risks: Medium confidence. Named pathways are identified, but their elimination is not guaranteed by the chosen path.
Decision frame
Decision being architected: A forward-looking capital-and-operations decision — continue funding the in-house ERP rebuild to completion, or stop and adopt an off-the-shelf (COTS) system. Scope: governs order-to-cash, supply chain, and financial close for ~5–10 years. Time horizon: decision this quarter (the immediate funding question covers the next 1–2 quarters); forward-cost window modeled at 5 years post-decision. Who decides: executive leadership / board-level (a ~$12M-class commitment); Engineering, Finance, and Operations own inputs, not the call. [analyst synthesis]
Sunk-cost rule, stated once and enforced mechanically: The $12M and four years are gone under every option and carry zero decision weight. The entire analysis is forward-only; the moment a figure includes past spend it is disqualified, and “we’ve come this far” reasoning is named as the sunk-cost fallacy wherever it appears.
One variable dominates this choice: the rebuild’s true completion state and realistic cost-to-finish. Everything else is second-order. [analyst synthesis, High confidence]
- If the rebuild is genuinely ~85%+ done, on a credible path, team intact → continuation dominates and switching destroys near-term value.
- If it is ~40–60% done at year 4 (the base-rate-likely case) → exit or hybrid dominates and continuing is throwing good money after bad.
The corrupting fact: the internal “we’re almost done” estimate is the least reliable number in the problem — produced by the party with the strongest sunk-cost and job-security incentive to defend continuation, and ERP/large-IT estimates exhibit severe planning fallacy. A 4-year-old rebuild that has not yet shipped is itself Bayesian evidence of failure-population membership; the prior on “completes near current estimate” should be low — roughly 20–40% absent contrary audit evidence, not the 50/50 optimism reports usually assume. [analyst synthesis; planning-fallacy is training-grounded, hedged]
Forward priors that apply to BOTH project paths (kept as distinct series, not summed into a composite, because they measure different things):
- ERP failure rate: projects “fail to meet objectives” at roughly 70–73%; discrete-manufacturing specifically ~73%, sourced to Panorama’s 2025 ERP Report [web, corroborated, w0.30: Godlan/Panorama; re-confirmed across ConcordERP, LinkedIn, Smartermrp, jobinandjismi]. Gartner separately: “>70% of recent ERP initiatives will fail to fully meet business-case goals by 2027; ~25% catastrophic” [web, w0.30: TechTarget/Gartner]. The Godlan “zero-failure track record” framing is named as vendor marketing; the underlying number is genuine and sector-specific.
- Cost overruns: ~62% of orgs overrunning >25%; ~47% average cost variance; average financial hit ~$2M+; ROI negative in ~31% of cases — but ⚠️ this cluster comes from a single aggregator (Gitnux) whose own pages are not self-consistent on re-verification (one page reports ~$1.95M average failed-project cost; “31%” appears elsewhere as a vendor-issue causation share, not a negative-ROI rate). Treat as indicative magnitude, not precise. [web, w0.30: Gitnux — single-source, re-verification inconclusive]
- Top-3 failure causes: inadequate change management, poor data migration, inexperienced/disengaged teams — ~75%+ of failures [web, w0.30: Godlan/Panorama].
- Scale anchors (marquee overruns): SAAQ ~$500M over; Birmingham/Oracle ~$216M total/re-implementation cost (the original project budget ballooned ~£19M→£90M+; $216M is the total figure) [web, w0.30: Elevatiq/CIO.com — re-confirmed]. 215% average overrun is the discrete-manufacturing figure [web, w0.30: Godlan/Panorama].
- Discarded as a category error: the “$40–50k average off-the-shelf ERP” figure [web, w0.30: rexsoftinc] is small-business scale and inapplicable to a $12M-class enterprise problem. [analyst, High confidence]
The load-bearing inference: the 70%+ failure base rate and top-3 causes are not eliminated by switching — they attach to any ERP program. Data-migration risk is in fact higher on a switch (two-system cutover off a legacy stack) than on a same-stack finish — directionally confirmed [web, w0.30: Consolidate.io/Trax/ClonePartner — “migration introduces data-quality risk and cutover complexity a fresh deployment never faces”; comparative magnitude unverified]. So the framing of “Switch = medium risk, commodity, known” is wrong: a switch is a fresh ERP implementation re-entering the 70%+ failure distribution at year 0; continuing re-enters it at year 4 — further along the danger curve where scope surprises land, but with sunk learning. Neither path is a safe harbor. [analyst synthesis, Moderate confidence]
Alternatives with probability-weighted outcomes
The original binary (keep / switch) was option-set-poverty. Six alternatives survive, four of them analyst-generated.
A0 — Continue to completion as planned
- Probability-weighted outcomes: Cost-to-finish = internal estimate × overrun multiplier. Using ~47% mean variance as a floor and the 215% manufacturing figure as a tail, model finish cost as a band, roughly 1.5×–3× the internal “remaining” estimate, with non-trivial mass on “never cleanly finishes.” P(clean on-time finish) low (~20–40%) unless audit shows genuine near-completion. [from decision-under-uncertainty; web w0.30 + analyst; point estimate requires org input] Opportunity-value, explicitly secondary to risk: if — and only if — the build genuinely fits non-standard processes, finishing preserves differentiation/IP value a commodity platform can’t replicate. Real but conditional; exactly what the audit must verify rather than assume. [analyst]
- Origin: user-supplied.
A1/D — Time-boxed independent completion audit/gate with pre-committed decision rules + parallel switch-side workstream (leading alternative)
- What it is: Fund one bounded increment (~4–6 weeks, capped spend) whose only deliverable is an independent technical-and-financial completion audit + a hardened remaining-cost-and-date estimate, against pre-committed decision rules that fire automatically. Run a parallel switch-side workstream in the same window — vendor fit-gap / proof-of-concept against genuinely non-standard processes + a binding enterprise quote — so the terminal call resolves both paths’ dominant uncertainty at once. Not “study it more”: buying the single input that dominates the decision, cheaply, before any irreversible commitment.
- Probability-weighted outcomes: small capped cost; resolves the dominant uncertainty, converting an irreversible bet into a staged one. The audit either (a) validates near-completion → commit to continuation with evidence, or (b) exposes far-from-done → exit to B/C with the sunk-cost argument empirically armed. Value-of-information positive under almost any number set. [from decision-under-uncertainty]
- Audit-cost anchor (load-bearing, hedged): order-of-magnitude ~$50–150k over 4–6 weeks — anchored to a published senior ERP/audit consultant day-rate of $800–$2,000/day [web, w0.30: Fincy] across a ~20–30-day window for a 2–3-person team. An estimate, not a procured quote; itself subject to the same overrun optimism the analysis warns about (stress-tested at 3× / 12 weeks below). [Claim resolution: unsupported as an exact package price; brackets reasonably but upper bound and duration not externally pinned.]
- VoI / EVPI inequality (structural demonstration, not assertion): The gate is rational whenever G < p × W — equivalently
audit_cost + delay_cost_during_audit < P(wrong A/B commit) × cost_of_a_wrong_commit. Let G = gate cost (capped, weeks); p = P(the internal “almost done” estimate is materially wrong), which base rates and planning-fallacy priors put above 0.5; W = the wrong-direction loss prevented (committing to A0 on a corrupted estimate when the build is ~half-done understates true remaining cost by plausibly several million on a $12M-class program, plus delay cost). With G in the low hundreds-of-thousands and p×W in the millions, the inequality clears by one-to-two orders of magnitude unless the audit is far costlier or the internal estimate far more reliable than the evidence supports. The exact ratio is set by org inputs (true completion %, gate cost). [analyst synthesis, Moderate–High confidence]
- Origin: analyst-generated.
B — Full switch to COTS
- Probability-weighted outcomes: Implementation cost = vendor quote × overrun multiplier (use ~1.15–1.5×, not an optimistic 1.15× alone — COTS overruns are common per the same base rates) + dual-running + migration + retraining + 5-yr license/support [from decision-under-uncertainty; web w0.30 + analyst; requires binding quotes]. ~55–70% chance of not fully meeting business case [web: Gartner]; ~31% negative ROI [web: Gitnux, indicative]; but probability of ending with no usable system at all is low — <10% [analyst inference], contrasted with A0 where total non-delivery is a live outcome. The asymmetric downside shape (failure here usually means “over-budget/disappointing,” not “no system”) favors B — but this advantage is conditional on COTS-fit being real. P(success) hinges on change-management and data-migration discipline — the very causes that sink most ERP projects. Opportunity-value, secondary to risk: a modern platform brings the vendor’s roadmap — notably the AI-enabled-ERP ecosystem “normalizing” in 2026 [web, w0.30: Panorama 2026/Gartner] — capability otherwise built and maintained in-house. Provenance-tagged, explicitly secondary; does not offset the migration-risk tail but belongs in the EV so the choice isn’t scored on downside alone. [analyst]
- Origin: user-supplied.
C — Hybrid / staged
- Probability-weighted outcomes: positive only if the rebuild is modular and ≥1 module is genuinely done (~80%+) and differentiated. Otherwise it’s the union of both cost structures plus permanent integration risk. Conditional, narrow. The “satisfies no one” instinct is right in the general case; C survives only under this specific structural precondition. [from decision-under-uncertainty; analyst]
- Origin: user-supplied / analyst-qualified hybrid.
D/E — Do-nothing / freeze-and-run / keep legacy (boundary anchor)
- Role: Keep running the legacy system that predated the rebuild (or run existing legacy + whatever rebuild is live), freeze active development, reassess. Usually dominated — accrues carrying cost (maintain a half-built system + aging legacy) with no progress; defers the decision rather than making it; a trap dressed as prudence unless cash is the binding constraint.
- Real function: forces the one number nobody has volunteered — the monthly cost of the status quo — the figure that anchors every other option’s urgency premium. Until quantified, every “we need it now” claim is unpriced. [analyst synthesis]
- Origin: analyst-generated.
F — Restructure-to-rescue
- What it is: Continue, but only after cutting scope to an MVP and changing project leadership/governance — “what would make Continue actually succeed?”
- Probability-weighted outcomes: plausible only if the audit (A1/D) shows the technology is sound and the failure cause was governance/scope, not engineering. F is effectively “A0 conditioned on the audit’s findings.” Risk: the same team/dynamics that produced 4 years of slip. [from decision-under-uncertainty; analyst]
- Origin: analyst-generated.
Binding constraints per alternative
[all from constraint-mapping]
- Key-person concentration
[org input: # irreplaceable architects] — applies to alternatives: A0, F (strengthens B, A1/D). Mechanism of binding: hard / contingent. Eliminates: if 1–2 people hold critical knowledge, eliminates/severely qualifies A0 and F (bets on those people staying); strengthens B/A1/D (vendor + market skills reduce concentration). Can flip A0 to non-viable regardless of EV math.
- Process idiosyncrasy
[org input: how non-standard are core processes] — applies to alternatives: B (re-legitimizes A0/F). Mechanism of binding: soft → hard. Eliminates: if order-to-cash genuinely cannot map to COTS configuration, this is the one constraint that re-legitimizes A0/F and qualifies B (heavy customization imports COTS’s own failure rate). The single most common honest reason in-house builds exist — test it, don’t assume it.
- Cash / capital runway
[org input] — applies to alternatives: A0, F, B. Mechanism of binding: hard. Eliminates: if forward funding is constrained, eliminates A0 and F (can’t fund two more years), pressures toward B’s phased license or freeze. If unconstrained, binds nothing.
- Cost-of-delay / operational pain
[org input: $/month of no stable system] — applies to alternatives: A0, F, B, A1/D. Mechanism of binding: hard if a real deadline exists. Eliminates: high monthly delay cost eliminates A0/F (slowest to stable), may eliminate B if COTS go-live is also distant, and can make even the 4–6 week audit window (A1/D) unaffordable — the self-cancel condition below.
- Public/political commitment to the rebuild
[org input] — applies to alternatives: B. Mechanism of binding: soft but real. Eliminates: nothing — doesn’t change economics but raises the political cost of B; qualifies B’s feasibility; is itself a sunk-cost-adjacent bias to name, not obey.
- Data-migration feasibility from current state — applies to alternatives: B. Mechanism of binding: hard. Eliminates: qualifies B independently of process-fit.
Stakeholder impact per alternative
[all from stakeholder-mapping]
| Stakeholder | Continue (A0) | Switch (B) | Audit (A1/D) | Power-asymmetry |
|---|
| Engineering team | + pride/job security; − burnout if slip continues | −− “we built something better” loss; morale/attrition; they’d have to execute the migration they oppose — disengagement is a risk, not just morale | ~ neutral-to-− (scrutiny may feel like a threat) | Low asymmetry — they influence the call and may bias it toward A0 |
| Project sponsor | + saves face on public commitment | −− “failure” optics | + audit gives cover for either call | Influencer; face-saving is a sunk-cost vector to name |
| Operations / business users | −− continued delay, broken processes | + path to working system, but migration disruption | + fastest route to an honest answer | High asymmetry — bears daily operational pain, rarely holds the capital vote; surface this voice explicitly |
| Finance / CFO | − open-ended forward spend; sunk-cost pull | + bounded, quotable cost; − transition spend | + cheap de-risking before a big commit | Influencer; watch CFO for sunk-cost reasoning specifically |
| IT support | − permanent in-house maintenance toil | + vendor carries patching | neutral | Bears long-run toil; moderate voice |
| Vendor | N/A | ++ revenue; will promise aggressive timelines — discount accordingly | neutral | Self-interested; not a neutral source |
| Customers / downstream partners | − if order-to-cash stays unreliable | − short-term migration disruption, + long-term stability | neutral | Highest asymmetry — affected by reliability, zero voice in the room |
Structural tilt finding: the absent high-asymmetry voices (operations end-users, customers) systematically favor getting to a working system over preserving the build; the visible room (Engineering + sponsor) over-represents continuation. The stakeholder map should correct for this tilt toward A0. [analyst synthesis]
Failure pathways for the leading alternative
Pre-mortem on the A1/D gate and its likely exit destination (B), in prospective hindsight, past tense. [all from pre-mortem-action]
- Pathway 1 — Captured/theater audit. The “independent” auditor leaned on the build team’s numbers (or was paid by a COTS faction/vendor); the gate rubber-stamped a decision already made — either confirming optimism for another wasted year, or scrapping a genuinely ~85%-done salvageable build. Causal pathway: conflicted auditor → laundered estimate → false confidence either direction. Leading indicators: auditor scope or personnel overlaps with the build team / vendor faction. Threshold: any build-team member or vendor-paid party on the audit. Recoverability: recoverable if caught at chartering (fix engagement terms); unrecoverable once the rebuild team disbands.
- Pathway 2 — Exit, then COTS fails the same way. We treated COTS as a safe harbor, under-resourced change management and data migration (the top-3 causes, ~75% of cases [web]), and the rollout sank. Causal pathway: “commodity = safe” assumption → thin change-management budget → base-rate failure. Leading indicators: COTS budget allocates real money to change management + data migration, not just license + config. Recoverability: recoverable — COTS failures are usually recoverable as over-budget, not total.
- Pathway 3 — Gate-as-stall. Leadership took the audit but didn’t pre-commit to the rules; the 6-week window stretched to 6 months; the sunk-cost coalition re-litigated “exit”; the rebuild kept burning cash in limbo (slipping into the dominated freeze option). The audit itself overran — the very optimism bias diagnosed in the rebuild applied to its own diagnostic. Causal pathway: no binding rules → re-litigation → time-box dissolves. Leading indicators: decision rules not signed before the audit begins; no hard calendar date; auditor asks for more time in week 2. Recoverability: unrecoverable once underway unless the time-box is contractual; recoverable if a scope floor was pre-agreed.
- Pathway 4 — Process idiosyncrasy was real and ignored. We exited, then discovered core processes genuinely don’t fit any COTS, forcing heavy customization that reintroduced custom-build risk on top of vendor cost. Causal pathway: fit-gap skipped or shallow → license signed → customization explosion. Leading indicators: did the audit actually test COTS fit against the 5–10 hardest real processes? Recoverability: unrecoverable/expensive once licensed.
- Pathway 5 — The destination broke (B-execution). We made the right call to exit and even resourced change management — but legacy data was far dirtier than the migration scope assumed; cleansing/reconciliation blew the timeline; COTS go-live slipped nine months; operations ran dual systems through two consecutive financial closes, double-keying and reconciling two ledgers, at a productivity-and-error cost exceeding the license. Causal pathway: unassessed data quality → migration scope wrong → dual-run blowout. Leading indicators: a data-quality assessment (row counts, duplicate/orphan rates, field-completeness on master tables) completed before migration scope is fixed; dual-running budgeted with a hard cutover date. Recoverability: recoverable — painful, expensive, but recoverable, unlike total non-delivery on A0.
Governance-failure observation: A1/D’s failure modes (1–4) are all governance failures, all front-loaded, all preventable at chartering — which is exactly why it is a safer leading bet than A0 or B, whose failure modes are execution-stage and far costlier to reverse.
The integration the four components produce together (no single one yields these):
- The base-rate prior defeats the option ranking. Switch is not the safe option; it re-enters a 70%+ failure distribution with higher data-migration risk. This collapses any “Switch is low-risk” strategic-score conclusion — those scores rested on assumptions the evidence rejects.
- A constraint (key-person concentration) can unilaterally eliminate A0 regardless of how the EV math comes out — if 1–2 people hold the architecture, the probability-weighted leader is moot.
- A probability-weighted leader (B’s favorable downside shape) is invalidated by one constraint (process idiosyncrasy). B’s advantage is conditional on COTS-fit being real, which is unverified; if processes can’t configure into COTS, B silently imports the same custom-build risk it was meant to escape.
- A stakeholder fact flips the pre-mortem on B. The people who’d execute the migration (Engineering) are the people most opposed to it; a switch decided over their resistance inherits an under-motivated migration team — the exact condition (disengaged team + data migration) the base rate says sinks ERP projects. The visible stakeholder map over-represents continuation; the absent high-asymmetry voices lean away from A0.
- A constraint and a failure mode are in direct tension. Cash-constraint or delay-cost pushes toward a fast exit (B); pre-mortem pathways 2 and 5 show a fast exit that under-resources change management or skips the data-quality assessment merely relocates the failure. Speed-favoring constraint vs. haste-punishing failure mode.
- The decisive variable is unmeasured, and no one in the room can measure it neutrally (Engineering conflicted, sponsor conflicted). A0’s probability, C’s viability, F’s premise, and B’s regret all hinge on it. This is why the leading recommendation is neither A0 nor B directly — it is the audit-gate (A1/D), the instrument that resolves the pivot cheaply before the expensive commit. The EVPI inequality shows the value of resolving completion-state uncertainty exceeds its cost by one-to-two orders of magnitude, and the gate is the only option that doesn’t require trusting the most-biased estimate in the room. The parallel switch-side fit-gap extends the same logic to the exit side, so the terminal call isn’t made with one path’s uncertainty resolved and the other’s latent.
Recommended alternative with residual risks
Recommended: A1/D — Adopt the audit-gate now: a ring-fenced, independent, calendar-boxed (4–6 week) technical-and-financial completion audit with pre-committed decision rules, run alongside a parallel switch-side fit-gap + binding-quote workstream — with a directional lean toward exit (B, or C if a complete differentiated module exists) as the terminal call unless the audit strongly validates near-completion.
Integrated rationale (across all four components): decision-under-uncertainty supplies the dominant unmeasured variable and the VoI inequality that makes resolving it cheaply the rational first move; constraint-mapping supplies the eliminators (key-person concentration can void A0; process idiosyncrasy can void B’s advantage) that mean neither leg can be committed blind; stakeholder-mapping supplies the structural tilt (visible room over-represents continuation; the migration’s executors oppose it) that argues against trusting either the internal estimate or a switch forced over Engineering; pre-mortem-action supplies the finding that the gate’s failure modes are all front-loaded and preventable while A0’s and B’s are execution-stage and costly. Integrated, the four say: don’t pick A0 or B blind — gate on an independent completion audit and a parallel switch-side fit-gap, with pre-committed rules and a directional lean toward exit if the audit doesn’t strongly validate near-completion.
Parametric decision boundary (forward-EV answered today as thresholds, since org numbers aren’t in hand):
Forward_cost(A0) = remaining_rebuild_cost × overrun_factor_inhouse
                   + 5yr_in_house_maintenance (≈ 3–5 FTE fully loaded × 5)
Forward_cost(B)  = (COTS_license + implementation) × overrun_factor_COTS
                   + transition_cost (migration + dual-run + retraining)
                   + 5yr_license_and_support
- Forward-cost dominance: Exit (B) dominates Continue (A0) on cost whenever
Forward_cost(A0) > Forward_cost(B). A 4-year unshipped rebuild justifies a high overrun_factor_inhouse (base-rate variance ~+47% [web: Gitnux, indicative], worse for already-late projects), so A0’s left side likely exceeds its roadmap claim.
- Outcome override: Forward cost is a data point, not the decision. Finish (A0/F) beats Exit only if
verified_completion > X% AND architecture sound AND process-fit poor enough that COTS needs heavy custom dev — all three conjuncts must hold; any one failing tilts to B. verified_completion is precisely what only the audit supplies neutrally.
- Audit value-of-information: the gate is worth doing while
audit_cost + delay_cost_during_audit < P(wrong commit) × cost_of_a_wrong_commit. With cost-of-wrong-commit in the multi-millions and P(wrong commit) high (deciding variable currently unmeasured), the right side dwarfs a ~$50–150k + ~6-week-delay left side under almost any plausible figures — and still holds even at 3× ($450k) / 12 weeks, unless monthly cost-of-delay alone rivals the expected loss from a wrong call.
Rules to commit in writing before the gate runs:
- Finish (A0) only if the independent audit shows the rebuild genuinely near-complete and realistic forward cost-to-finish is below the risk-adjusted forward cost of switching (grounded by the parallel binding quote) and key-person risk is mitigated.
- Exit (B, or C if a complete differentiated module exists) if the audit shows far-from-done, or forward cost-to-finish exceeds switch cost on like-for-like risk adjustment — and the switch-side fit-gap has cleared its own process-fit threshold.
- The $12M never enters either rule.
Why a lean toward exit rather than neutrality: the base rates [web, w0.30], the year-4 danger-zone position, the structural unreliability of the internal “almost done” estimate, and the room’s sunk-cost/political pulls all tilt the prior against continuation. But the cost of wrongly killing a genuinely-85%-done system is large and one-way — so the recommendation gates rather than exits outright. A deliberate asymmetry, not a hedge; the lean is held by the audit, not asserted over it.
Self-cancel clause (when the audit-gate is the wrong call): if you face an imminent hard deadline (regulatory close, contract, mandated system change) AND a high monthly cost-of-delay, the 4–6 week audit window is itself unaffordable (delay_cost_during_audit breaches the VoI inequality). In that case do not run the gate: commit directly — almost certainly to B — and resource its change-management and data-migration budget as the load-bearing risk (pre-mortems 2, 5), accepting that you forgo rebuild-salvage information to buy time. The gate leads only while delay cost is affordable.
Residual risks the recommendation does NOT eliminate:
- It does not de-risk the eventual ERP program — whichever path the gate selects still faces the 70%+ base rate; change-management and data-migration discipline remain the deciding execution variables. [web, w0.30]
- It does not protect against a captured/non-independent audit (pre-mortem 1) — the auditor must be sourced outside both factions and the COTS vendor.
- The parallel fit-gap reduces but does not remove COTS process-fit risk — a proof-of-concept can still miss surprises that surface only at full-scale cutover (pre-mortem 4).
- It cannot prevent the audit window degrading into freeze-and-run without a hard date and pre-committed trigger — and the audit itself can overrun (pre-mortem 3).
- It does not remove the political/sunk-cost coalition — it constrains it with evidence and pre-commitment, but a determined sponsor can still override.
- It cannot manufacture the org-specific numbers; cost bands are benchmark-derived, the audit-cost figure is an estimate not a quote, and the single-aggregator overrun cluster is indicative only.
Decision conditions to monitor
- Audit completion-health finding (the gate’s deliverable) — observable signal: verified completion <70% OR major architectural defects → exit (B); ≥85% + sound architecture + governance-only failure cause → restructure (F). Monitors: A0 viability. Trigger: threshold crossing fires the pre-committed rule. Signal latency: 4–6 weeks (the audit itself).
- Cost-to-finish drift (A0 path) — observable signal: monthly burn vs. the audit’s remaining-estimate baseline; threshold: >15% cumulative variance over baseline; also rebuild slip velocity >20% over last 3 sprints strengthens exit. Monitors: A0 cost-overrun risk. Trigger: variance/slip threshold breach. Signal latency: ~1 month (month-end close) / ~2–3 weeks (one sprint).
- Key-person risk — observable signal: resignation/notice or extended absence of a named critical architect; threshold: any single critical-knowledge holder departs/signals exit → A0 and F lose viability immediately. Monitors: A0/F viability. Trigger: departure of a named-critical architect. Signal latency: immediate-to-2 weeks (notice period); watch continuously. (Operationally detectable only if a named-critical-architect list exists — see required inputs.)
- COTS quote dispersion — observable signal: ≥3 binding quotes incl. change-management + migration line items; threshold: even the low binding quote exceeds remaining-rebuild forward cost AND process-fit is poor → B weakens. Monitors: B cost case. Trigger: low binding quote above A0 forward cost. Signal latency: 3–6 weeks to procure.
- COTS process-fit / implementation health (B path) — observable signal: the 5–10 hardest real processes mapped to vendor config + data-migration defect rate in test loads + milestone slippage; threshold: >2 core processes need heavy custom dev → B’s safety advantage erodes; master-data defect rate >1–2% in test loads [benchmark heuristic, confirm exact go/no-go band with your data team] OR any milestone >30 days late. Monitors: B execution risk. Trigger: any threshold breach. Signal latency: within the audit window / ~2–4 weeks per migration test cycle.
- Legacy data-quality assessment (pre-migration) — observable signal: duplicate/orphan rate + field-completeness on master tables; threshold: dirty-data rate above the migration-scope assumption → re-budget B’s timeline and dual-run period before cutover (pre-mortem 5). Monitors: B migration risk. Trigger: dirty-data rate above scope assumption. Signal latency: 2–4 weeks to assess.
- Cost-of-delay / status-quo cost (D anchor) — observable signal: monthly quantified cost of operating on current/legacy system (operational incidents attributable to no stable ERP); threshold: establish the number now; if it exceeds the audit’s information value → compress or skip the audit, force the call (self-cancel clause). Monitors: audit-gate affordability. Trigger: monthly delay cost rivals expected wrong-call loss. Signal latency: ~1 month; track from now.
- Vendor-promise realism (B) — observable signal: ratio of vendor-quoted timeline to independent reference-customer actuals; threshold: quoted timeline <70% of comparable reference implementations → discount the quote. Monitors: B timeline risk. Trigger: quote-to-actual ratio below 70%. Signal latency: at quote/reference-check, days.
Excluded as a monitor: “run a sensitivity analysis” / “watch how it develops” — sensitivity analysis is a one-time pre-decision step, not an observable ongoing signal.
Confidence map
| Atom | Stage | Confidence | Basis |
|---|
| ERP failure base rate ~70–73% / Gartner >70% by 2027 | component | Moderate–High | multiple independent corroborating sources, re-confirmed, all w0.30 |
| Cost-overrun cluster (47% / 62% / ~$2M / 31% neg-ROI) | component | Low–Moderate | single aggregator (Gitnux); own pages inconsistent on re-verification — indicative only |
| 215% overrun / SAAQ $500M / Birmingham ~$216M | component | Moderate | corroborated; Birmingham figure is total/re-implementation cost |
| 73%/215% is a vendor-framed (Godlan) Panorama-2025 discrete-mfg figure | component | Moderate | number genuine and sector-specific; “zero-failure” framing is marketing |
| COTS $40–50k is inapplicable (scale mismatch) | component | High | unambiguous category error |
| ”4-yr unshipped → failure-population” Bayesian inference | component | Moderate–High | strong logical force; degree depends on slip history [org input] |
| Audit cost/duration $50–150k / 4–6 weeks | component | Low | bracketed by published $800–2,000/day rate; not a procured quote; overrun-prone |
| Constraints / stakeholder tilt (cash, key-person, absent-voice) | component | Moderate | structurally sound; magnitudes [org input] |
| Switch re-enters failure distribution at year 0 | synthesis | Moderate | sound but inference |
| Migration risk higher on switch than finish | synthesis | Moderate | direction confirmed (Consolidate.io/Trax/ClonePartner); magnitude unverified |
| Completion-state is the dominant variable | synthesis | High | structurally robust |
| Internal “almost done” estimate corrupted by incentive | synthesis | Moderate | well-supported by planning-fallacy priors [training, hedged] |
| EVPI / VoI inequality favors the gate | synthesis | Moderate–High | structural demonstration; exact ratio set by org inputs |
| Audit-gate (A1/D) is the rational first move | synthesis | Moderate–Low to Moderate–High | follows from the above; contingent on governance and on delay-cost staying affordable (self-cancel clause) |
| Directional lean toward exit | synthesis | Low–Moderate | a prior, explicitly overridable by the audit it recommends |
| Any specific dollar figure for your project | — | None / Not held | [requires org input] — not estimated, to avoid confabulation |
Synthesis-stage atoms are deliberately rated below component-stage atoms; the directional lean is the lowest-confidence claim and is designed to be overturned by the very audit it recommends.
The decision cannot be computed because the dominant inputs are org-specific [requires org input]; those most likely to flip the recommendation outright are marked ★. These must not be invented — they are the confabulation gap, and the analysis stops at thresholds rather than producing fabricated point estimates.
- ★ Independent (not internal) realistic cost-to-finish and true completion %.
- Binding COTS quotes — license + implementation + migration + 5-yr support at enterprise scale (ignore small-business price points).
- Historical project overrun multiplier (apply to both paths).
- ★ Key-person count for critical knowledge — and whether a named-critical-architect list exists (without it the key-person monitor is not operationally detectable).
- Quantified monthly cost of the status quo / cost-of-delay.
- ★ Whether any public/board commitment politically forecloses exit.
- Process-fit: how non-standard core processes are vs. COTS defaults (the parallel fit-gap produces this).
- The data team’s go/no-go master-data defect threshold (the monitoring section uses a 1–2% benchmark band pending this).
Unresolved tensions worth flagging
These are preserved rather than reconciled — they mark where the analysis converges, where it relies on indicative-only data, and where a domain reviewer would add value.
- Leading-alternative framing convergence with a residual difference. Two independent passes converge on the same recommended instrument — a time-boxed independent audit/gate with pre-committed rules and a lean toward exit. They differ in emphasis, and both refinements are retained as complementary rather than competing: (a) a parallel switch-side fit-gap/binding-quote workstream so the terminal call resolves both paths’ uncertainty symmetrically; (b) a self-cancel clause under which an imminent hard deadline + high monthly delay cost makes the audit unaffordable and flips the recommendation to direct-to-B. Neither contradicts the other; both qualify the same leading alternative.
- Cost-overrun cluster status. One resolution downgraded the 62%/47%/$2.4M/31% cluster to “indicative only” after finding the aggregator’s own pages inconsistent; another kept the figures as a distinct, separately-attributed series not contradicted by adjacent sources. Preserved tension: the figures are real as published but single-aggregator and not cleanly self-consistent — used directionally, never summed into a composite rate, confidence Low–Moderate. Resolves only with a primary-source (Panorama full report) cost-overrun distribution.
- Whether the Engineering-resistance-flips-the-B-pre-mortem finding is a true cross-component derivation versus two co-located observations remains a domain-judgment call; it would resolve with a decision-analysis reviewer check on whether the stakeholder→pre-mortem link is causal or merely adjacent.
(visual rendered — see artifact)