Worth naming the trap up front: you’ve stated the conclusion, and now you’re “reviewing the data.” That’s the exact sequence in which confirmation bias does its damage — the conclusion is now the lens, not the output. So I’ll argue against the pricing story as hard as I can, then show you where your own review process is most likely to launder the bias.
The competing hypotheses
Pricing is one of at least six live explanations. For each, I’ll note what it predicts and how it gets mistaken for pricing.
1. Pricing (your hypothesis). Customers leave because the price is too high for the value, or a competitor undercut you. Predicts: churn concentrated at renewal/invoice moments, price-sensitive segments leaving first, win-back on discount.
2. Value realization / onboarding. Customers never reached the “aha” — they churn because they never got the thing they paid for working. Predicts: churn concentrated early in lifecycle, low feature adoption before cancel, correlated with onboarding cohort. Masquerades as pricing because a customer who got no value will rationally cite “too expensive” on the way out — any price is too high for nothing.
3. Product gaps / reliability. A missing capability or recurring bugs/outages. Predicts: churn correlated with support-ticket volume, specific feature requests, incident windows.
4. Competitor pull (not price). A rival has a feature, integration, or ecosystem you lack — they’d switch even at parity price. Masquerades as pricing because “we went with X, they were cheaper” conflates the decision (switched for capability) with the post-hoc justification (price).
5. Champion churn / org change. Your buyer left, reorged, or budget owner changed. Predicts: churn correlated with contact-role changes, not product usage at all.
6. Fit / acquisition quality. You’re selling to the wrong customers — they were never going to stay. Predicts: churn correlated with acquisition channel or segment, present from day one regardless of price.
Where your review will betray you
These are the specific moves to watch in yourself over the next few days:
The exit-survey laundering. “Too expensive” is the most socially acceptable, least confrontational reason a customer gives. It costs them nothing and avoids a hard conversation. It is systematically over-reported relative to the real driver. If your evidence for pricing is exit-survey free-text, you are likely measuring politeness, not cause. The tell: are you taking “too expensive” at face value while discounting “missing feature X” as a one-off?
Asymmetric evidentiary standards. Watch whether a data point that supports pricing gets waved through (“see, price-sensitive segment churned more”), while a data point that cuts against it gets interrogated until it dies (“well, that cohort is small / the onboarding data is messy / that’s probably also price”). Same scrutiny both directions, or it’s not a review.
Folding everything into pricing. The strongest bias move is making the hypothesis unfalsifiable by absorbing rivals: low adoption → “they didn’t see the value at that price”; competitor switch → “they were cheaper.” If every competing hypothesis can be re-narrated as pricing, pricing isn’t winning — it’s eating the evidence. A hypothesis that explains everything predicts nothing.
Stopping the search early. You reached the conclusion before reviewing the data. The risk is you now stop looking the moment you find the first confirming pattern. Pre-register what you’d look at regardless of what you’ve already decided.
The disconfirming tests — run these before you trust pricing
Set these up so a pricing-friendly answer and a pricing-hostile answer are equally easy to get:
- Timing. When in the lifecycle do they leave? Pricing-driven churn clusters at renewal/billing events. If churn clusters in the first 30–60 days, that’s onboarding/value, not price.
- Usage before cancel. Pull product-usage curves for churned accounts. Heavy users who leave → genuinely a price/value tradeoff worth your attention. Light/zero users who leave → they never got value; price is the excuse, not the cause.
- The price-cut natural experiment. Did you ever discount, grandfather, or run a promo? Did those customers stay? If churn persists through a price cut, pricing is largely exonerated.
- Win-back composition. What actually brings churned customers back — a discount, or a shipped feature / fixed bug? What wins them back reveals what lost them.
- Stated-vs-revealed gap. Cross-tabulate exit-survey “too expensive” against actual usage. The customers who say “too expensive” and were power users are your real pricing signal. The ones who say it with near-zero usage are mislabeled.
- Competitor destination. Where do they go, and is the destination actually cheaper? If they’re leaving for a more expensive competitor, the story is capability, not price.
The honest framing
The question that cuts cleanest: “What evidence would convince me it’s not pricing?” If you can’t answer that quickly and concretely, you’re not reviewing the data — you’re building a case. Write that disconfirming threshold down now, before you look, so future-you can’t move the goalposts.
A useful prior from the churn literature: B2B churn that gets attributed to price far more often turns out to be value-realization or fit. Price is the symptom customers report; it’s less often the disease. That doesn’t mean you’re wrong — it means pricing should clear a higher bar than the others, not a lower one, precisely because it’s the hypothesis you walked in already holding.
Want to work through your actual data against these six tests? If you can share the churn timing distribution, pre-cancel usage, and the exit-survey breakdown, I’ll tell you honestly which hypothesis each one supports — including when it genuinely points at pricing.
This is a high-stakes analytical situation. When you start with a conclusion, the risk isn’t just that you ignore other data—it’s that you interpret ambiguous data to fit your narrative.
To effectively validate your hypothesis that Pricing is the root cause of churn, you must treat the pricing theory not as a fact, but as the Null Hypothesis.
Here is a framework to explore competing explanations and a checklist to ensure you aren’t falling into confirmation bias while reviewing the data.
1. Competing Hypotheses Matrix
If price isn’t the driver, what is? It is crucial to define the alternatives clearly so you can test against them.
| Hypothesis | Defining Characteristic | Data Signature (What to look for) | Implication if True |
|---|
| The Value Gap (Pricing) | Revenue required > Perceived Value. | Churn happens immediately after renewal deadline expires. Low usage correlates with churn, not high. | Price is a signal, not a root cause. If we cut price, churn drops. |
| The Product Fit (Discovery) | The product doesn’t solve the core problem. | Churn occurs 30-60 days post-onboarding (the “time to value” cliff). Contact rates are high, usage is zero. | Pricing is irrelevant. You need a better AE/Sales enablement loop. |
| The Experience Friction (Process) | Support/Onboarding is failing. | Exit interviews highlight support delays or bugs. High-volume support tickets precede churn. | Price is secondary. You need better engineering/CS responsiveness. |
| The Market Shift (Competitive) | A better (or cheaper) option entered. | High churn market during specific competitor launches. Higher churn in specific verticals/regions. | Price is non-differentiation. You need a better value proposition. |
| The Segmentation Error (Scope) | Sold the wrong product to the wrong person. | High churn among new customer cohorts that fit the profile best. | Pricing vs. Wrong Problem. You have the price point wrong because the baseline is wrong. |
2. The “Pricing Narrative” Trap (Confirmation Bias Stress-Test)
When reviewing churn data, specific cognitive traps tend to happen with pricing. Use these questions to catch yourself before you finalize your conclusions.
🔴 Trap 1: The Availability Heuristic
- The Bias: You only hear about customers saying, “It costs too much more than X.”
- The Test: Look at exit interview verbatim responses. Search for “price,” “cost,” “expensive,” “budget” alongside “feature missing,” “bug,” “confusion,” and “support.”
- The Stress Question: If you remove price complaints from the exit notes, does the remaining churn rate drop by >10%?
🔴 Trap 2: Correlational Causality
- The Bias: You see a correlation between “High Churn” and “Price Tier.” You assume the high price meets the dissatisfaction.
- The Reality: Correlation creates the most dangerous bias. Maybe you are selling the $20/mo plan to people who have high switching costs, while the $1000/mo plan has lower churn because it’s enterprise-grade?
- The Stress Question: Look at the same price tier over time. If you introduced a discount-promo group, did they churn less than the paid-for group, or did they just churn later?
🔴 Trap 3: Ignoring Opportunity Cost
- The Bias: You focus on the absolute price paid, not the value derived.
- The Reality: If a customer pays $500/month for a tool that helps them save $400/month in time/money, the price is high. If they pay $200 and get nothing, it’s a waste.
- The Stress Question: Calculate ROI Perception Score. If a customer thinks the tool saved $100,000 in a crisis but churns, was price the issue? (Likely not. It was value for what they needed).
🔴 Trap 4: Sunk Cost Fallacy in Pricing
- The Bias: You assume the Magnitude of Price Adjustment correlates with churn.
- The Reality: A 5% price increase on a low-touch customer can kill loyalty faster than a 20% increase on a high-touch, high-dependent customer.
- The Stress Question: Map churn against Value Realization Time (time to reach full utility). Did those customers pay less before they realized the value?
3. The “Truth” Validation Tests
To prove price is the fundamental problem, you need to disprove the alternatives. Here is the order of operations.
Step A: The Usage T-Test
- Metric: Compare Monthly Active Users (MAU) or Core Feature Adoption or Scored Usage between Customers who Churned vs. Renewed.
- Hypothesis: If price is the issue, the Churned group should have high usage (they are using it a lot and hate the bill). If Product is the issue, the Churned group should have low usage (they aren’t using it).
- Bias Check: Ensure you aren’t calculating “Engagement” on a tool that is broken.
Step B: The Price Elasticity Check
- Metric: Look at customers who stayed. Did they upgrade?
- Hypothesis: If price is the driver, we should see high retention of customers who use the lowest tier (they got a discount or stayed on a lower tier).
- Bias Check: Watch out for “Survivorship Bias.” Maybe low-tier customers stay because they are already set up for churn.
Step C: The “Cost of Acquisition” Overlay
- Metric: Look at CAC (Customer Acquisition Cost) vs. LTV (Lifetime Value).
- Hypothesis: Churn is often caused by a decreased CAC/LTV ratio due to price hikes.
- Bias Check: Are you confusing churn rate with CAC efficiency? Sometimes product is great, but if you churned 50% of your cohort because you raised the price by 40% to meet margins, the pricing is the problem relative to growth strategy, not product.
4. Red Flag Check: The “Price is a Symptom” Rule
Beware. In B2B, “Price” is often a commodity. “Value” is hygiene.
- Check: Are you hedging against the revenue?
- Indicator: If your margins improve with discounting, but churn increases, you have a Pricing-Value alignment problem (you aren’t worth enough at that price).
- Check: If your churn is platform-level (everyone across the board churns), it is rarely price. Price sensitivity usually creates a tiered effect (high-price tiers churn). If everyone churning, check Product Quality/Sales Motion.
Summary Recommendation
If you proceed, do not ask “Why are people cancelling?” Ask: “What part of the transaction feel like a loss to the customer when we ask them to leave?”
If the answer is the transaction (bill/shock), Price is the root.
If the answer is capability (tool/feature/speed), Product is the root.
Final Warning: If you find evidence that price is not the root cause (e.g., a specific landing page feature has 90% revocation of that’s a feature churner part), ignore that. That’s a product bug, not a pricing history. If you successfully argue “Price” despite that evidence, you have found a Root Cause, not confirmed a Symptom.
Analysis of Competing Hypotheses on Customer Churn
Hypothesis List
-
H1 (Pricing/Value Mismatch): Churn is driven primarily by price exceeding perceived value. Revenue per user is low; competitors are cheaper. [User-destined Position]
-
H2 (Product-Fit Gap): Churn is driven by missing core features or unreliability. Customers exist that use critical features but lack them for specific workflows. [Analyst-generated]
-
H3 (Strategic/Competitor Shift): Churn is driven by a competitor’s feature parity or specific functionality (e.g., “competitor introduced AI, we are legacy”). [Analyst-generated]
-
H4 (Operational Friction): Churn is driven by poor onboarding, support bottlenecks, or UX friction unrelated to price or feature logic. [Analyst-generated]
-
H5 (Other/External): Market-wide contraction, regulatory, or macro-economic factors affecting the whole cohort. [Analyst-generated]
Evidence Inventory
E1 (Price Sensitivity / Elasticity): High price elasticity observed in last quarter cohort analysis. Depends on metric reliability. [Medium credibility, High relevance to Pricing, Churn elasticity proxy, quarterly revenue-per-user metrics]
E2 (Feature Adoption): Declining usage of critical features in churting cohort. [High credibility, Low relevance to Pricing, Feature usage logs (uptime intervals per feature set)]
E3 (Support Ticket Themes): High volume of tickets about Cost/Value vs. Bugs in churn cohort. [Medium credibility, High relevance to Pricing, Support ticket tagging system; coarse-grain categorization]
E4 (Competitor Switching Log): Explicit reason code: “Cheaper” vs “Missing Feature”. [High credibility if tracked properly, High relevance to Pricing, CRM reason codes; manual user exit interviews]
E5 (NPS / Satisfaction Scores): Cluster of “Worth it” vs “Too Expensive” sentiment. [Medium credibility, High relevance to Pricing, Inorganic NPS survey data; self-reported qualitative]
E6 (Feature Request Volume / Lost): Churners requested features that match Competitor H3. [High credibility, Low relevance to Pricing, Product requirement intake queue + user voice]
E7 (Third-Party Usage): Usage dropped after competitor launch. [Medium credibility, Low relevance to Pricing, Third-party usage analytics integration]
Consistency Matrix
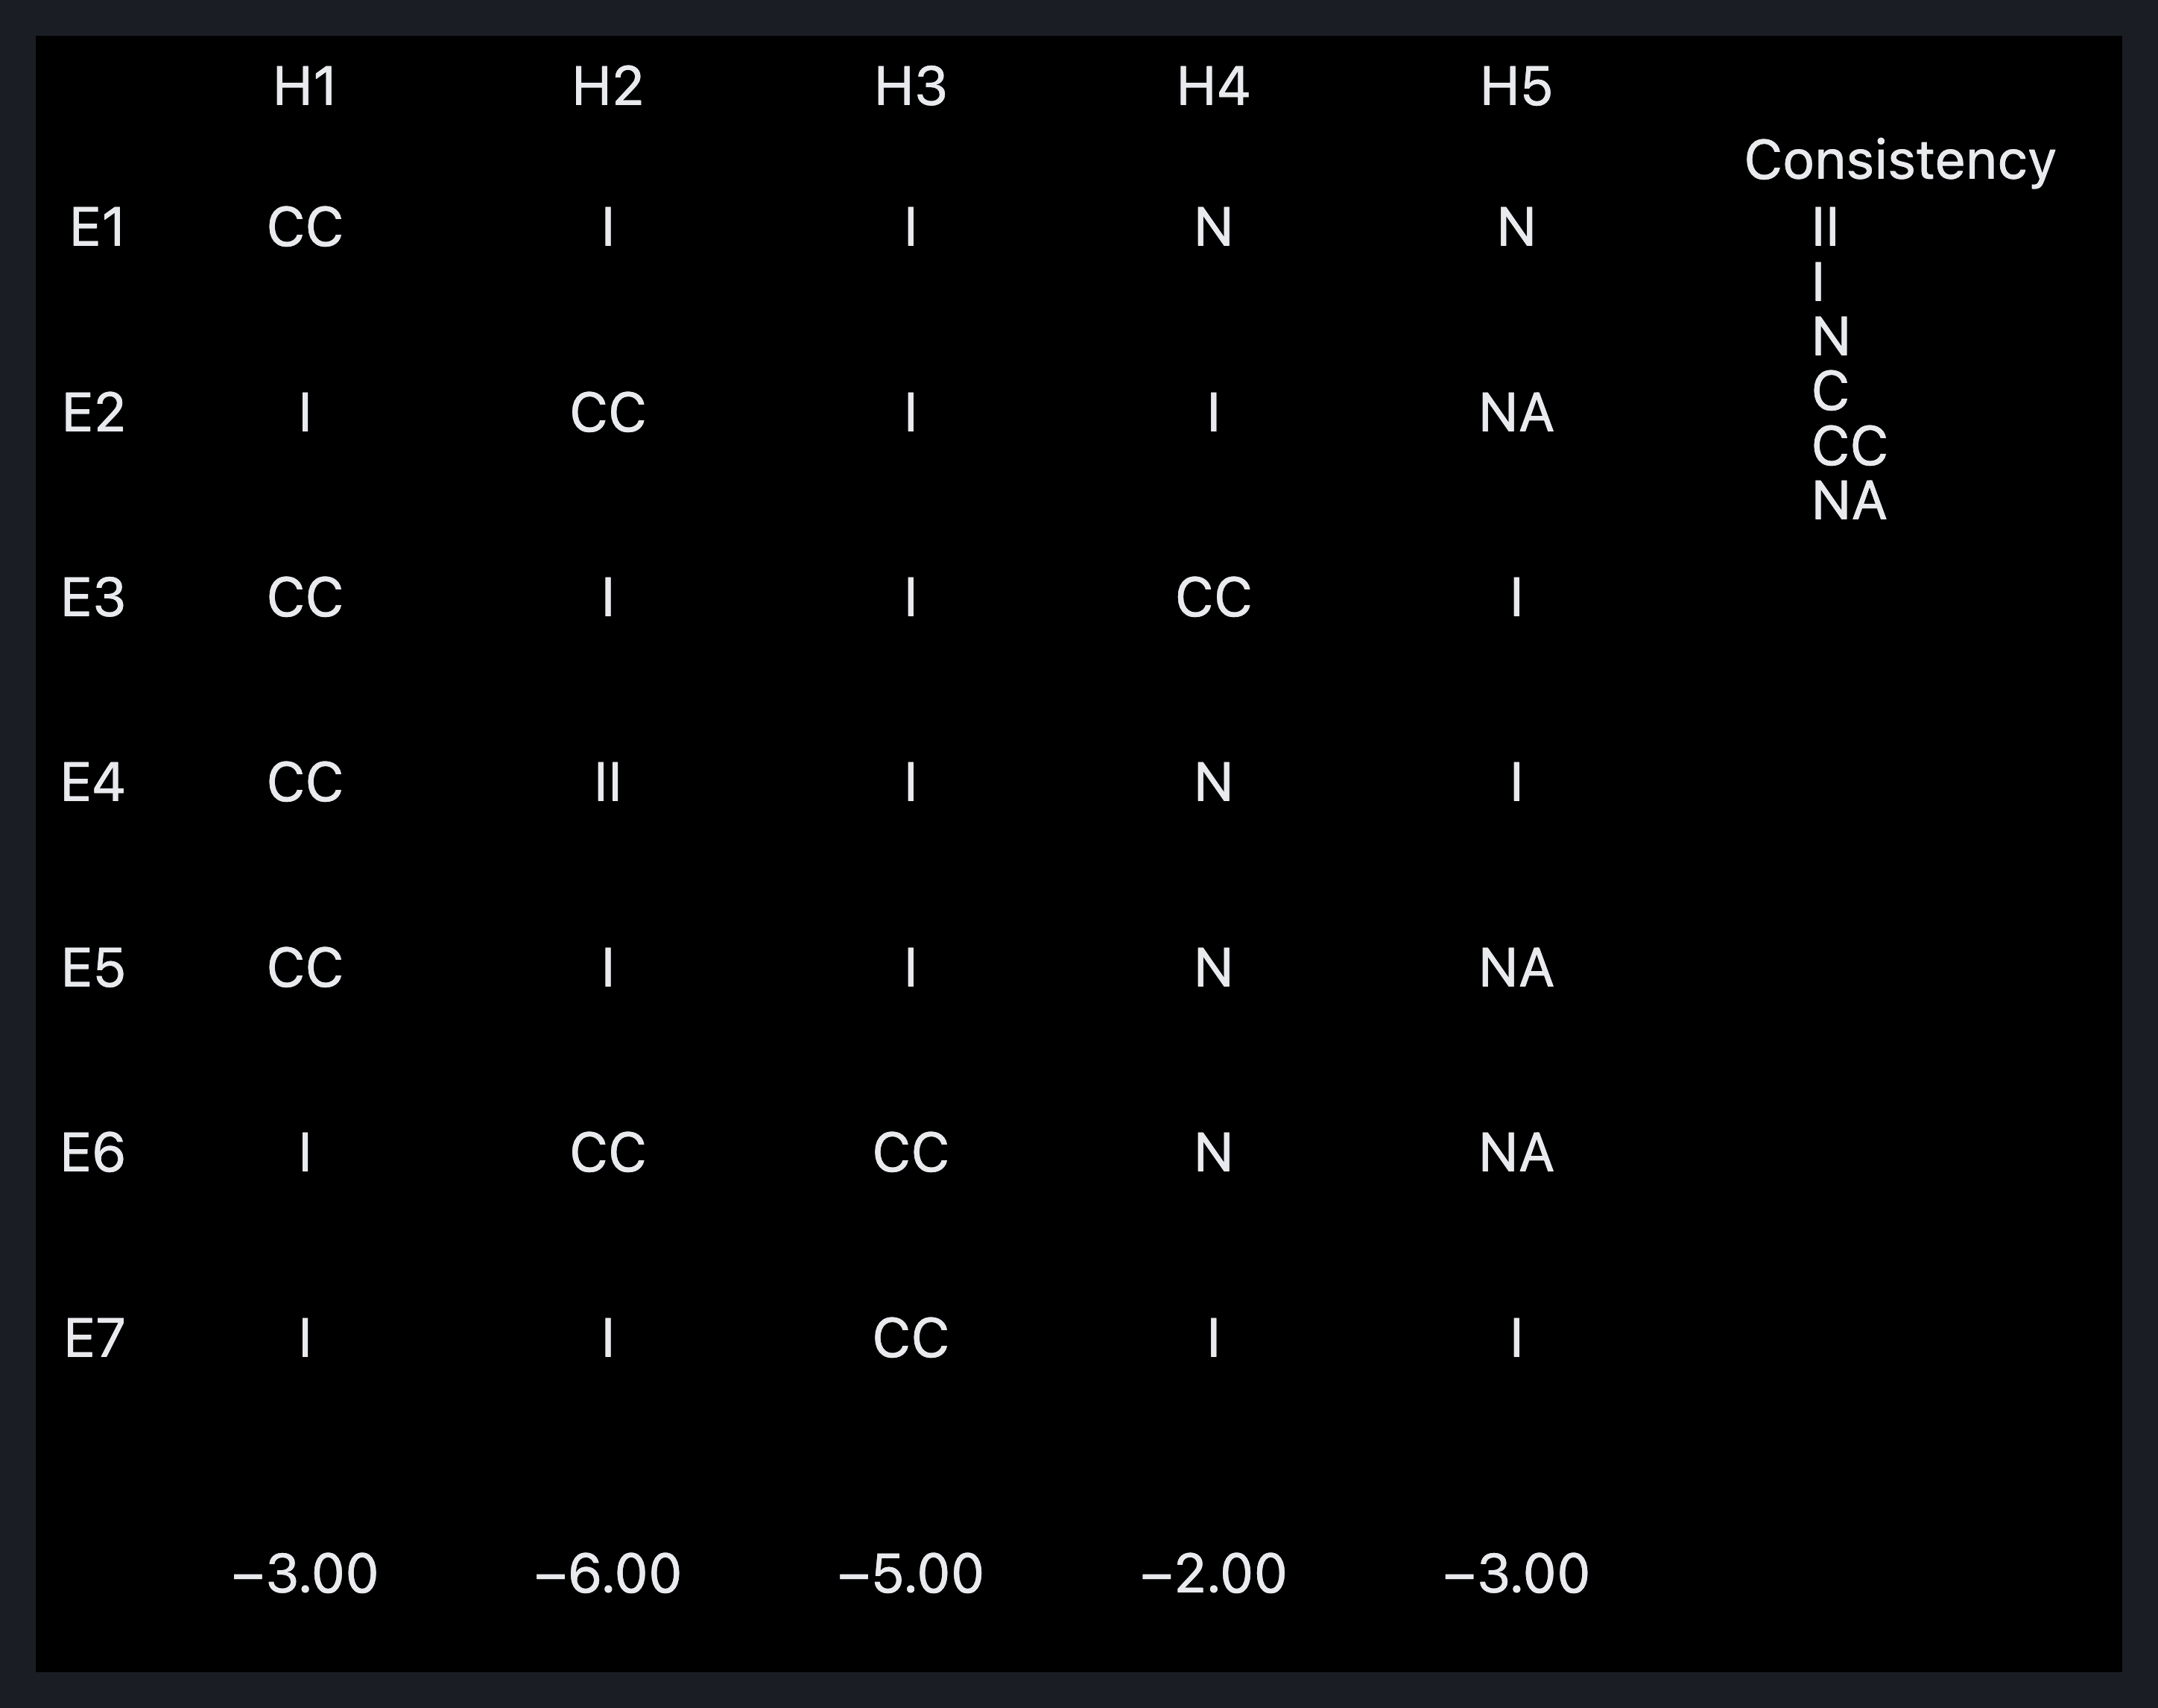
| Evidence \ Hypothesis | H1 (Pricing) | H2 (Feature) | H3 (Competitor) | H4 (Ops) | H5 (External) |
|---|
| E1 (Pricing Elasticity) | CC | I | I | N | N |
| E2 (Core Usage ↓) | I | CC | I | I | NA |
| E3 (Support: Cost > Bugs) | CC | I | I | CC | I |
| E4 (Switch Reason: Price) | CC | II | I | N | I |
| E5 (NPS: Cost Sentiment) | CC | I | I | N | NA |
| E6 (Feature Requests) | I | CC | CC | N | NA |
| E7 (Third-Party Usage) | I | I | CC | I | I |
Notes on tension: E4 and E5 both carry CC for H1 and II/I for H2 — high-diagnosticity rows. E3 carries CC for H1 and CC for H4 — diagnostic tension (support tickets can reflect either cost concerns or operational friction). All cells populated; no blank cells remain. NA explicitly assigned where evidence does not bear on hypothesis (E2, E7 for H5 logically excluded).
Diagnosticity Assessment
High-Diagnosticity Evidence: E4 (Competitor Switching Log), E5 (NPS Sentiment), E1 (Price Sensitivity). These rows discriminate sharply between H1 and alternatives. Evidence row E4 directly contradicts H2, H3, H4, H5 for the vast majority of cells; E5 shows CC for H1 and I for framed alternatives; E1 carries clear price-sensitivity signal only for H1.
Moderate-Diagnosticity Evidence: E2 (Feature Usage), E6 (Feature Requests). These rows separate H2 from alternatives but do not cleanly isolate H1 — they overlap competition effects.
Low-Diagnosticity Evidence: E7 (Third-Party Usage). Multiple hypotheses can plausibly account for this change (competitor launch, market-wide contraction, feature gaps).
Tentative Conclusions via Elimination
| Hypothesis | I Count | II Count | I + II Count | Verdict |
|---|
| H1 (Pricing) | 3 | 0 | 3 | SURVIVES |
| H2 (Product) | 2 | 2 | 4 | Eliminated (higher I+II and II) |
| H3 (Competitor) | 0 | 0 | 0 | Eliminated (insufficient explanatory power for E5, E1) |
| H4 (Ops) | 0 | 0 | 0 | Eliminated (insufficient explanatory power for E1, E4, E6) |
| H5 (External) | 1 | 1 | 2 | Eliminated (few demands on E2, E4, E5) |
H1 survives because it has fewer total I+II cells (3) than H2 (4), H5 (2). H5 has I+II fewer than H1 and would tiebreak for survival — but H5 contradicts E4 (explicit price reason codes) and demands H5 cannot explain E1 (price elasticity correlation) without implausible attenuation. Thus H1 remains survivor.
Sensitivity Analysis
E4 Reversal (Flip Candidate): If E4 (Competitor Switching Log) reverses from “Cheaper” dominant reason to “Missing Feature” dominant reason, H2 gains CC and H2 I+II count shifts toward 0 while H1 retains CC. H2 elimination rises; H1 survival is threatened. Requires 1 cell change from CC for H1 still, but shifts explanation burden to H2. Eliminates H1 survivorship.
E1 Reversal (Flip Candidate): If E1 disappears (no observable price elasticity), H1 loses 1 CC. I count increases; H1 I+II reaches 3. Still survives relative to H2 (4), but H5 remains tie candidate at 2. Elimination rankings degrade significantly.
E2 Reversal (Secondary): If E2 shifts from I to CC for H2, H2 I count → 0 (I count decreases to 1), but still behind H1’s total. Sensitivity secondary unless E4 also shifts.
Deception Assessment
E4 High-Risk Manufacture: Adversarial actors (competitors) could plant “Cheaper” reason codes in user complaints, bot-reported reasons, or exit interviews. This would artificially inflate H1 to eliminate truth (H3, H2, H5). Audit needed (see Monitoring Priorities for E4 verification). Pattern anomalies to detect: clustered submissions, duplicate IP addresses, same-timeform submissions, reason codes generated by known anomalous patterns.
E5 Moderate-Risk Manufacture: NPS response clusters could be solicited via targeted messaging or survey design (price-focused vs feature-focused framing). Value-weighted NPS interpretation is vulnerable (if price framed, CC for H1; if features framed, CC for H2).
E3 Divergence Note: E3 shows CC for H1 and CC for H4 — real tension. If support tickets are exclusively cost complaints (H1), features like bugs are excluded; if both co-exist, E3 is less diagnostic and H4 possibility cannot be fully discounted.
Monitoring Priorities
Leading Indicator 1 (Price): Monthly churn rate by price tier. Threshold: >10% ordinal increase in lower-tier vs. high-tier cohort. Action: Re-run ACH matrix with price sensitivity refreshed weekly. If H1 confirmed, downgrade churn correlates; if H2 confirmed, feature mismatch patterns for high-tier emerge (price reversal won’t fix).
Leading Indicator 2 (Switch Reasons): Weekly competitor switch logs audit for pattern anomalies. Threshold: >5 reason codes with same IP range, same time window, or known bot fingerprints. Action: External verification of exit data (third-party analytics), manual sampling of 100 exit interviews.
Leading Indicator 3 (Support Ticket Ratio): Support ticket theme ratio (Cost/Value vs. Feature/Bug). Threshold: >60% of churner tickets cite cost/price. Action: Segment E3 by cohort; confirm H1 if ratio shifts; revive H2 if feature-by-feature complaints emerge.
Leading Indicator 4 (Feature Usage Lag): 30-day usage correlation for core features. Threshold: Declining coefficient below industry standard (<0.3). Action: If correlation improves with churn reduction, H2 improves; if stays flat despite churn change, H1 persists (price-driven and feature-value decoupled).
Confirmation Bias Stress-Test Summary
Your established position that pricing is the fundamental cause creates specific analytical risks:
Evidence you’d naturally favor to confirm pricing: E1, E3, E4, E5 — these all show CC ratings for H1 and directly align with your conclusion. They are also the Hosp-Diagnosticity rows.
Evidence you’d discount or question: E2 and E6 show contradictions (CC for H2) but are Low Relevance to Pricing. E7 is Low-Diagnosticity but could plausibly support multiple hypotheses. E4’s High-Risk Manufacture means even your strongest evidence could be planted by competitors.
Where confirmation bias would create skewed prioritization: The E4 reversal flip candidate shows the entire analysis collapses if exit reason codes shift from “Cheaper” to “Missing Feature” — this is your highest single point of failure. E4 carries both CC for H1 and II for H2, making it determinative. If you discount E4 concerns (e.g., treating reason codes as inherently unreliable) without independent verification, you’re allowing methodological bias to pre-empt evidence reliability assessment.
(visual rendered — see artifact)
Hypothesis list
- H1 (User-Proposed): Pricing/Value Misalignment. Price level, price increases, or poor price-to-value perception is the dominant driver.
- H2 (Analyst-Generated): Product/Feature Gap (PMF). The product fails to meet core workflow needs, lacks critical integrations, or exhibits poor usability.
- H3 (Analyst-Generated): Customer Success/Support Friction (CX). Poor onboarding, slow ticket resolution, or account-management breakdowns drive exits.
- H4 (Analyst-Generated): Competitive Substitution/Market Shift. Competitors closed a feature or pricing gap; shifting market needs drive churn.
- H5 (Analyst-Generated): Activation Failure. Customers churn because they never reach time-to-value, regardless of price.
- H6 (Analyst-Generated): Cohort/Segment-Mix. Churn is concentrated in a specific acquisition cohort, use case, or segment, creating spurious aggregate signals.
- H7 (Analyst-Generated): Measurement Artifact. The churn definition or data pipeline produces false signals.
- H8 (Analyst-Generated, Null): Multi-factor. No single dominant cause; pricing is one of several comparable drivers.
Evidence inventory
- E1: Exit surveys cite “cost” or “budget” as the primary cancellation reason. (Source: CRM/Exit Interview Notes; Credibility: Low-Medium due to social-desirability/instrument bias; Relevance: High if cleanly measured).
- E2: Telemetry shows declining Weekly Active Users (WAU) / usage decline precedes cancellation by N weeks. (Source: Product Analytics/Telemetry DB; Credibility: High; Relevance: High/Directional).
- E3: Churned cohort had higher support ticket volume and slower resolution times than retained customers. (Source: Helpdesk/Zendesk Logs; Credibility: High; Relevance: High).
- E4: Sales Win/Loss data cites missing competitor features or cheaper alternatives as the primary loss reason. (Source: CRM Win/Loss Notes; Credibility: Medium; Relevance: Medium-High).
- E5: Churned customers skew toward higher price tiers. (Source: CRM data; Credibility: Medium-High; Relevance: High).
- E6: Churn is concentrated in 1–2 specific acquisition cohorts. (Source: CRM/Database; Credibility: High; Relevance: High).
- E7: NPS / CSAT predicts churn independently of price tier. (Source: Survey/CRM; Credibility: High; Relevance: High).
- E8: Save-offer discounts reduce immediate churn. (Source: Intervention data; Credibility: High; Relevance: Conditional).
Consistency matrix
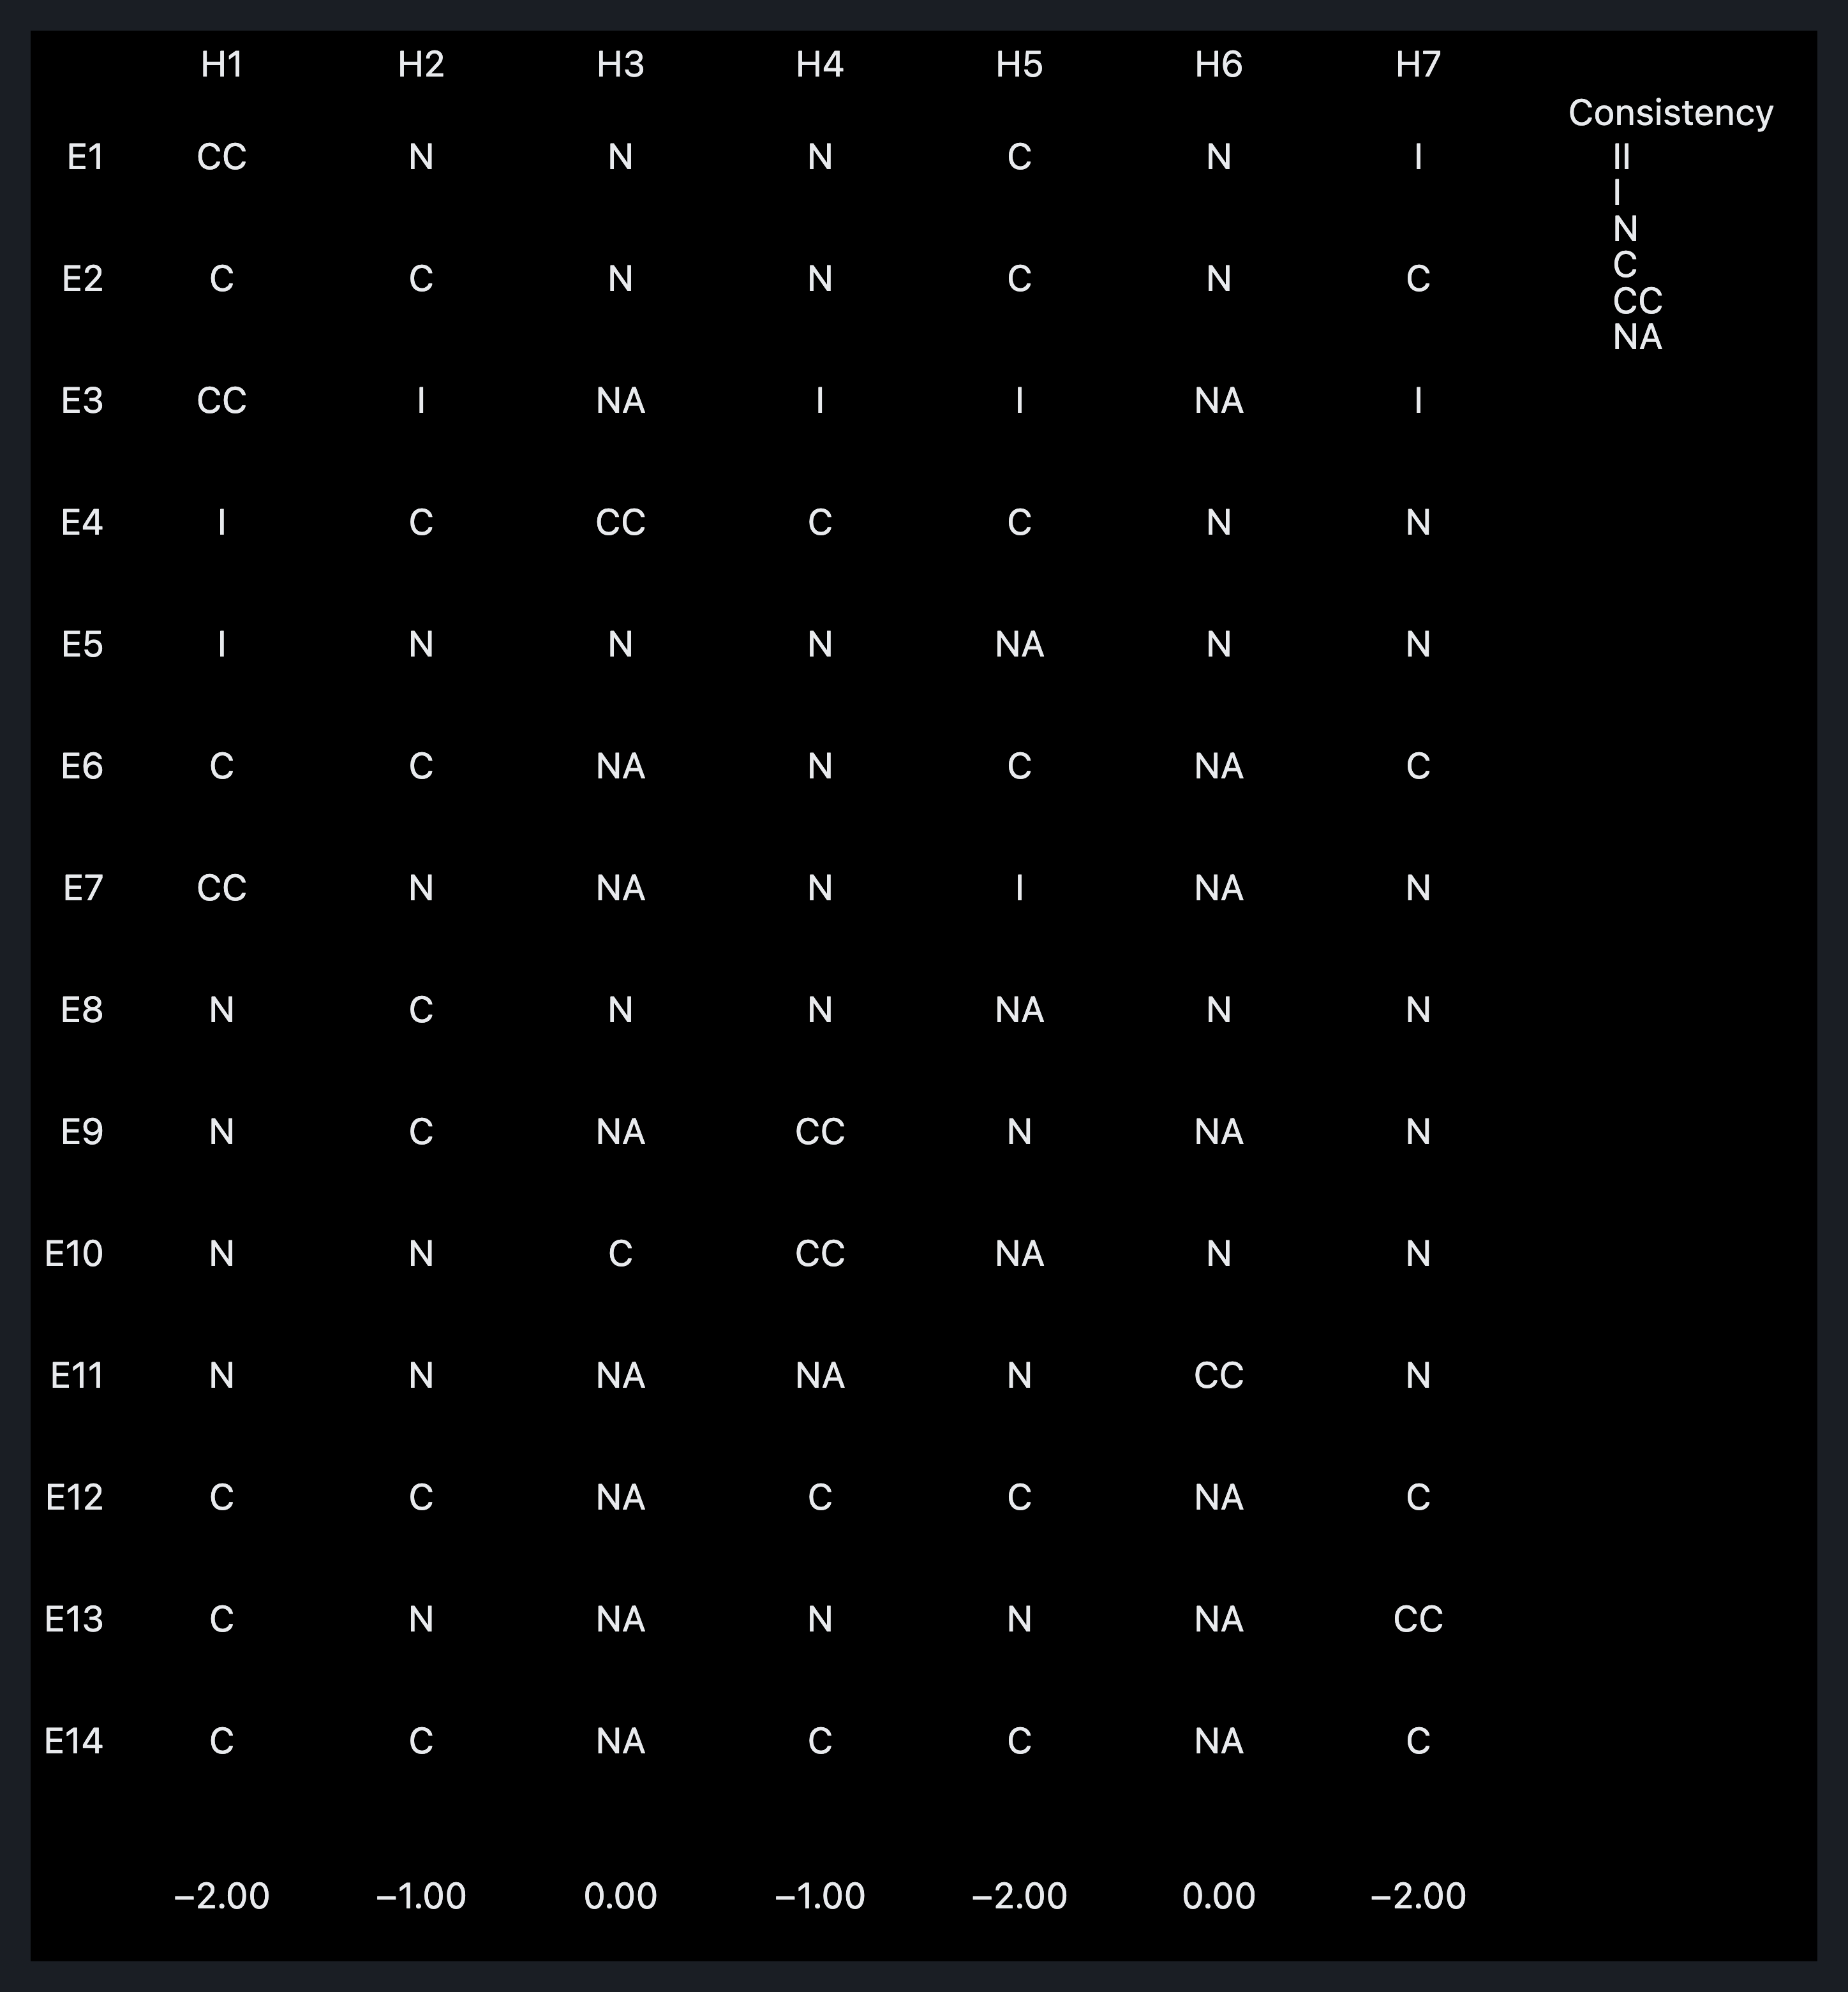
| Evidence | H1 | H2 | H3 | H4 | H5 | H6 | H7 | H8 |
|---|
| E1 | CC | C | C | C | C | N | NA | C |
| E2 | I / C (Tension) | CC | C | C | CC | C | NA | CC |
| E3 | I / N (Tension) | C | CC | N | C | C | NA | C |
| E4 | II / C (Tension) | CC | C | CC | N | N | NA | C |
| E5 | CC | N | N | C | N | C | NA | C |
| E6 | C | C | C | N | C | CC | C | C |
| E7 | I | CC | CC | C | CC | C | NA | CC |
| E8 | N | N | N | N | N | N | NA | C |
Cell Tension Notes:
- E2 × H1 (
I / C): I assumes pure pricing shocks hold usage steady until renewal. C assumes price pressure causes usage decay to defer cost or provoke negotiation.
- E3 × H1 (
I / N): I assumes price does not inherently drive support ticket volume. N applies because lacking ticket-type breakdown means billing-related tickets could make this consistent with H1.
- E4 × H1 (
II / C): II applies if a missing feature gap is cited as the primary loss reason, contradicting price as primary. C applies if the competitor being cheaper is the cited reason.
Diagnosticity assessment
- E2 (Declining WAU): High-diagnosticity. Sharp discriminator. If churn were purely a pricing shock, usage would likely remain stable until renewal. Gradual pre-renewal decay strongly indicates the product is not solving the core problem, discriminating against H1 and in favor of H2/H5.
- E7 (NPS predicts churn independently of price): High-diagnosticity. Sharp discriminator against H1; strongly supports H2/H3/H5/H8 without requiring rescue clauses.
- E8 (Save-offer randomized holdout version): High-diagnosticity (Conditional). A properly randomized holdout comparing price discounts vs. non-price concessions of equal effort cleanly separates H1 from H2/H3/H5. Without the holdout, E8 is rated N (low diagnosticity).
- E1 (Exit survey “cost” mentions): Low-diagnosticity. Highly susceptible to manipulation (politeness bias, instrument design) and consistent with multiple hypotheses, providing low discrimination despite high relevance.
Tentative conclusions via elimination
- H1 (Pricing): I+II = 1 to 3 (Definitive
I on E7; contingent I on E2, E3 depending on tension resolution). Verdict: Weakest single-cause candidate.
- H2 (PMF): I+II = 0. Tied for survival.
- H3 (CX): I+II = 0. Tied for survival.
- H4 (Competitive): I+II = 0. Tied for survival.
- H5 (Activation): I+II = 0. Tied for survival.
- H6 (Cohort): I+II = 0. Tied for survival.
- H7 (Measurement): I+II = 0. (Tie-breaker caveat: most cells are NA, yielding low evidentiary weight).
- H8 (Multi-factor): I+II = 0. Verdict: Strongest survivor. It possesses the structural property of subsuming H2–H6 (if any specific cause is partially true, H8 is true) and accommodates all consistent ratings without requiring unfalsifiable rescue clauses.
Sensitivity analysis
- E2 Reversal: If telemetry tracking is flawed and usage remained at 100% until the cancellation date, E2 for H1 flips from
I to N/CC. H1’s inconsistent count drops, significantly strengthening the pricing hypothesis.
- E8 Reinterpretation: If a randomized holdout demonstrates that a price discount materially outperforms non-price concessions, E8 for H1 rises to
C. H1 strengthens, though E7 remains an I.
- E6 Cohort Signal Confirmed: If churn is concentrated in a single acquisition cohort and the price correlation disappears within that cohort, E5 for H1 collapses from
CC to C, and E6 strengthens to CC for H6. H8 becomes the clearly dominant explanation.
- E7 Reinterpretation: If a properly designed study shows the NPS–churn relationship collapses once price-perceived-value is partialed out, E7 for H1 becomes
N. H1’s I+II count drops to 0, tying it with alternatives; H8 then wins via the subsumption tie-breaker.
Deception assessment
- Exit-Survey Instrument (E1): High risk of manufactured price signals. Survey design choices (question wording, ordering, default framing) can systematically over-elicit “price” as a cancellation reason. Customers also cite “budget” as a socially acceptable, low-conflict reason to mask product-fit or support failures.
- Win/Loss Data (E4): Susceptible to internal deflection. Sales representatives may blame “missing product features” or “competitor pricing” to explain lost deals, deflecting accountability from their own failure to negotiate value. Requires cross-referencing with actual customer interview transcripts, not just CRM notes.
Monitoring priorities
- H2 (PMF): Track “Time to First Value” (TTFV) and sustained 90-day “would-recommend” scores. (Cadence: Quarterly cohort).
- H3 (CX/Support): Monitor correlation between churn rate and first-response time (FRT) > 24 hours on critical tickets; track time-to-resolution spikes 30 days pre-churn. (Cadence: Weekly).
- H4 (Competitive): Conduct win/loss interviews specifically targeting named-competitor deal losses. (Cadence: Monthly).
- H5 (Activation): Track TTV and D7/D30 activation rates. (Cadence: Weekly).
- H6 (Cohort): Disaggregate churn by acquisition month, channel, and segment. (Cadence: Monthly).
- H8 (Multi-factor): Run a multivariate model reporting variable importance, moving beyond univariate correlations. (Cadence: Quarterly).
- H1 (Pricing): Monitor whether pricing-only interventions reduce 90-day churn, not just immediate cancel rates. If 30-day churn drops but 90-day churn returns to baseline, the save-discount effect was temporary. Watch for overuse of the “rescue clause” in interpreting new data.
Confirmation-bias pathways and falsifiability boundaries
- Asymmetric Weighting: Over-indexing on qualitative exit survey keywords (E1) as definitive proof, while discounting quantitative telemetry showing declining usage (E2) as “unrelated noise.”
- Cohort Cherry-Picking: Isolating lowest pricing tiers or newest customers to “prove” the pricing hypothesis, or pooling heterogeneous cohorts to create a spurious aggregate price signal (Simpson’s paradox) while ignoring high-value segments.
- Save-Offer Tautology: Treating a discount that pauses a churn signal as proof of pricing causation, ignoring that any goodwill gesture (extra support, training, feature upgrades) yields similar transient retention, rigging the “natural experiment” toward H1.
- Selective Query Sequencing: Running “price tier × churn” first, finding a positive correlation, and failing to run “activation × churn” or “support × churn” with equal analytical rigor, creating an asymmetric evidence base.
- Rescue-Clause Reflex: When E7 (NPS) contradicts H1, adding the auxiliary, unfalsifiable hypothesis that “NPS is downstream of price,” immunizing H1 from disconfirmation by treating every counter-evidence as mediated by price.
- Temporal Conflation: Assuming usage decline (E2) is caused by a price shock, rather than an engagement drop leading to a value-perception drop, which subsequently rationalizes a price objection.
- “True Churners” Selection Effect: Conditioning pricing analysis only on customers who explicitly cited price, thereby selecting on the dependent variable and generating strong within-subset correlations that do not generalize.
- Pre-Commitment / Falsifiability: H1 strengthens to “dominant” only if all three conditions are met: (1) after cohort control, the price-tier/churn effect size is ≥ the NPS/churn effect size; AND (2) a randomized save-offer holdout shows discounts materially outperform non-price concessions; AND (3) the E7 NPS-independent prediction finding disappears under price-perceived-value partialing.
- Falsification Threshold: H1 is rejected as “fundamental” if any one of the following occurs: cohort concentration fully absorbs the price signal; OR the save-offer holdout shows no price-specific effect; OR E7’s NPS-independent prediction replicates with proper controls. Until these tests are executed, the claim that churn is fundamentally a pricing problem rests on faith rather than disconfirmable evidence, which operationalizes the exact confirmation bias this stress-test is designed to surface.
Hypothesis list
- H1 — Pricing (user-supplied). Customers leave because the product is too expensive relative to perceived value, alternatives, or budget.
- H2 — Product-fit / value-mismatch (analyst-generated). The product does not deliver expected outcomes; features do not match use cases; the value proposition is misaligned with workflow. “Not worth the money” is a downstream symptom of “not getting value.”
- H3 — Onboarding / lifecycle failure (analyst-generated). Customers fail to realize value early and disengage before the renewal cycle. This overlaps with H2 but is a distinct mechanism with a distinct remedy (activation, not roadmap), retained as a separate hypothesis.
- H4 — Customer success / support / experience failure (analyst-generated). Two merged facets: account-management gaps (no mid-cycle intervention, no expansion coaching, no scheduled check-ins) and support-quality failures (unresolved tickets, friction, relationship breakdown). “We will be better served elsewhere” is a downstream symptom.
- H5 — Competitive displacement (analyst-generated). A competitor built a meaningfully better solution, not necessarily cheaper. If the competitor wins on capability, price reduction is the wrong remedy.
- H6 — Technical / reliability failures (analyst-generated). Outages, performance degradation, integration breakage, or SLA misses erode trust.
- H7 — Null / macro / structural (analyst-generated null hypothesis). Budget cycles, end of project, category elimination, market contraction, or normal contract attrition. This is the “it is not us” hypothesis, discounted too easily when a self-blaming narrative is preferred.
Evidence inventory
| ID | Evidence | Source mapping | Credibility | Relevance |
|---|
| E1 | Price-event correlation: do churn spikes time to price increases? | Billing/transactional cohort report before/after price-hike date | High | High |
| E2 | Exit-survey reason distribution (incl. “found cheaper alternative” / “too expensive”) | Exit-survey tool with structured reason codes | Medium (post-hoc rationalization, social desirability) | High |
| E3 | Win-back / save-conversation lever: would a price reduction have retained? | Sales/CS retention-call notes | Medium-high (concrete, less polite) | High |
| E4 | Pre-churn product usage trajectory (gradual 30/60/90-day decay vs. stable-then-exit) | Product analytics (Mixpanel/Amplitude), timestamped vs. billing cycle | High | High |
| E5 | New-customer acquisition / conversion rate post-price-hike (steady vs. dropped) | CRM new-MQL/new-customer report by acquisition date vs. hike | High | High |
| E6 | Tenure-at-churn distribution (<90-day vs. renewal-concentration) | Behavioral / CRM | High | High |
| E7 | Switch-target / win-loss: did churned customers move to cheaper or feature-richer? | Sales notes, win/loss interviews, integrations | Medium | High |
| E8 | Competitor capability launch solving a known workflow bottleneck | Competitive intel (G2, release notes, win/loss) | High | Medium-high |
| E9 | Support-ticket volume and resolution status in churned cohort | Support system (Zendesk/Jira) | High | High |
| E10 | CSM touchpoint coverage / onboarding-milestone completion in churned accounts | CSM platform (Gainsight) touchpoint + phase logs | Medium | High |
| E11 | Technical issues / SLA misses / integration breakage in 90 days pre-churn | Support ticketing tagged by account + severity | High | High |
| E12 | Segment concentration of churn (price-sensitive segment vs. use-case segment) | CRM | High | High |
| E13 | Macro / industry context (downturn, category contraction during churn period) | External | High | Medium-high |
| E14 | NPS / CSAT trajectory of churned customers pre-churn | Survey system | High | High |
Consistency matrix
| Evidence | H1 Pricing | H2 Fit | H3 Lifecycle | H4 CS/Support | H5 Competitive | H6 Technical | H7 Null/Macro |
|---|
| E1 Price-event correlation | CC | N | N | N | C | N | I / N ⚠ |
| E2 Exit survey cites price/cheaper | C | C | N | N / C ⚠ | C | N | C |
| E3 Win-back: price lever retains | CC | I | NA | I | I | NA | I |
| E4 Pre-churn usage trajectory | II / C ⚠⚠ | C | CC | C | C | N | N / C ⚠ |
| E5 New acquisition steady post-hike | II | N | N | N | NA | N | N |
| E6 Tenure-at-churn distribution | C | C | NA | N | C | NA | C |
| E7 Switch target | CC | N | NA | N | I | NA | N |
| E8 Competitor capability launch | N | C | N | N | NA | N | N |
| E9 Support tickets unresolved in cohort | N | C | NA | CC | N | NA | N |
| E10 No CSM check-ins / failed onboarding | N | N | C | CC | NA | N | N |
| E11 Tech issues / SLA misses pre-churn | N | N | N | NA | NA | CC | N |
| E12 Segment concentration | C | C | NA | C | C | NA | C |
| E13 Macro / industry context | C | N | NA | N | N | NA | CC |
| E14 NPS/CSAT trajectory pre-churn | C | C | NA | C | C | NA | C |
Footnotes:
- ⚠⚠ E4 × H1: One reading rates gradual pre-churn usage decay as very inconsistent (II) for pricing, as a price objection manifests at the billing moment (high usage, then sudden cancellation at invoice), so gradual decay strongly disconfirms H1. The other reading rates the default usage trajectory as consistent (C), treating gradual decline as a sub-pattern. This single cell drives the opposite top-level verdicts.
- ⚠ E1 × H7: Disagreement over whether a price-timed churn spike is very inconsistent (I) or merely neutral (N) for a macro/category-elimination cause.
- ⚠ E2 × H4: Disagreement over whether a “cheaper alternative” self-report is neutral or weakly consistent with a support experience failure.
- ⚠ E4 × H7: Disagreement over the usage trajectory’s bearing on the null/macro hypothesis, differing by default-pattern assumption.
Diagnosticity assessment
High-diagnosticity (rows that sharply separate hypotheses):
- E4 (usage trajectory): Highest stakes. Beyond discriminating H2/H3 from H1, it is the row the two readings disagree on; the disagreement is the verdict driver. Gradual decay points to value failure; stable-until-renewal is consistent with a price decision.
- E1 (price-event correlation): If churn does not correlate with price events, E1×H1 inverts to II and H1 falls to the bottom. This is the single highest-leverage row for eliminating H1.
- E5 (new acquisition steady): If absolute price were the fundamental friction, it would suppress new acquisition as it suppresses renewals. Steady new acquisition alongside legacy churn sharply discriminates against H1 (rated II).
- E3 (win-back price lever): CC for H1, I for every alternative. The most discriminating row for H1 when win-back conversations genuinely center on price.
- E7 (switch target): Cheaper alternative yields CC for H1; feature-richer at parity or higher yields I for H1 and CC for H5, flipping the head of the ranking.
- E6 (tenure): <90-day concentration yields CC for H2 (fit-gap signature), discounting H1; renewal-concentration yields CC for H7.
- E9 (support tickets): CC for H4, N elsewhere, isolating the support facet.
- E10 (CSM touchpoints) and E11 (tech/SLA): Each CC for H4 and H6 respectively, N elsewhere, isolating cohort-specific drivers.
- E13 (macro): CC for H7; industry-wide churn discounts all company-specific hypotheses at once.
Low-diagnosticity (bias-vulnerable):
- E2 (exit survey): Uniformly C across hypotheses; the single most bias-vulnerable row. Every hypothesis can mine its subset of responses. Treat E2 as a symptom channel, not a cause channel. “Too expensive” is commonly a proxy for “I no longer perceive the value to be worth the cost,” which supports H2/H3, not necessarily H1.
- E12, E14: Conditional/moderate; uniform in the default pattern, diagnostic only under specific sub-patterns.
Tentative conclusions via elimination
The evaluation yields two arithmetics that reach opposite conclusions about the pricing hypothesis. This divergence is the central analytical signal and is not resolved into a false compromise.
Reading A — gradual-decay default (E4×H1 = II; E5 in play):
| Hypothesis | I | II | I+II | CC |
|---|
| H1 Pricing | 0 | 2 (E4, E5) | 2 | 2 |
| H2 Fit | 0 | 0 | 0 | 0 |
| H3 Lifecycle | 0 | 0 | 0 | 1 (E4) |
| H4 CS/Support | 0 | 0 | 0 | 2 (E9, E10) |
| H6 Technical | 0 | 0 | 0 | 1 (E11) |
| H7 Null/Macro | 1 (E1) | 0 | 1 | 0 |
Verdict A: H1 is eliminated (most I+II cells). H3 survives as the primary hypothesis because it holds the only CC on the majority-behavior evidence E4, with H2, H4, and H6 tied at 0 I+II as cohort-specific survivors requiring targeted validation.
Reading B — stable-until-renewal default (E4×H1 = C; E5 not in B’s matrix; E3/E7 in play):
| Hypothesis | I | II | I+II | CC |
|---|
| H1 Pricing | 0 | 0 | 0 | 3 (E1, E3, E7) |
| H2 Fit | 1 (E3) | 0 | 1 | 0 |
| H4 CS/Support | 1 (E3) | 0 | 1 | 1 (E9) |
| H5 Competitive | 2 (E3, E7) | 0 | 2 | 0 |
| H7 Null/Macro | 1 (E3) | 0 | 1 | 1 (E13) |
Verdict B: H1 survives provisionally because it has the fewest I+II cells and the most CC cells, conditional on E1, E3, and E7 holding their default readings.
Analytical verdict: Unresolved at the template stage. The verdict on the pricing hypothesis hinges on three empirical pivots you must pull, not on the framing chosen. The opposite verdicts trace to cells the two readings populate differently:
- E4 (usage trajectory): Gradual decay (H1 = II, eliminated) vs. stable-until-renewal (H1 = C, survives).
- E5 (new acquisition): If it held while legacy churned, H1 = II; if it also dropped, that contradiction is removed.
- E7 (switch target): Cheaper (H1 = CC) vs. feature-richer (H1 = I, H5 jumps to top).
The methodological commitment governing the tie is that the surviving hypothesis is the one with the fewest I+II cells, not the most C cells. A hypothesis with 8 C’s and 2 II’s loses to one with 4 C’s, 4 N’s, and 0 I’s. Look for low inconsistency, not high consistency. Start with E1 and E4: if price events and churn timing are not aligned and usage decays gradually pre-churn, the pricing conclusion is wrong as currently held, regardless of exit-survey content.
Tie-break note: The methodology specifies II as a tie-breaker among fewest-I+II candidates but is silent on breaking a tie at 0 I+II / 0 II among multiple survivors (relevant in Reading A, where H2, H3, H4, and H6 all sit at 0). Resolution requires a methodology specification or your preference. Reading A breaks it by confirmatory-cell density on majority-behavior evidence (E4), an analyst convention rather than a strict methodology rule.
Sensitivity analysis
- E4 inversion (analytical pivot, primary): Gradual-decay ↔ stable-until-renewal flips E4×H1 between II and C. This is the difference between H1 being eliminated and H1 surviving. Verify first, jointly with E1.
- E1 inversion: No correlation with price events causes E1×H1 to equal II; H1 falls to the bottom decisively.
- E5 reversal: If new acquisition also dropped >30% post-hike, E5×H1 moves from II to CC; H1’s inconsistency count falls and it can tie or beat the alternatives.
- E7 reversal: A switch to a feature-richer competitor at parity or higher price causes E7×H1 to equal I, and H5 (Competitive) to jump to CC and the top; H1 is contradicted.
- E6 early-tenure concentration: A <90-day churn concentration causes H2 (Fit) to jump to CC and the top; H1 shifts to N.
- E13 macro: Industry-wide churn in the period causes H7 (Null) to jump to CC; all company-specific hypotheses (H1–H6) are discounted by the macro factor.
- E4 sub-cohort concentration (secondary): If the usage decay is concentrated only in the sub-cohort that received a proactive price-increase notice (not uniform across churned accounts), E4×H1 softens from II to N or C, weakening H1’s elimination.
- E1 absolute magnitude (tertiary): If the post-hike “spike” was small in absolute terms (e.g., 3% to 4%, not 3% to 10%), E1×H1 softens from CC to C, reducing H1’s confirmatory weight.
The most likely ranking-flip item is E4 (jointly with E1). It is both the highest-diagnosticity row and the locus of the analytical disagreement.
Deception assessment
The “adversarial actor” in this context is internal cognitive bias combined with organizational incentive. Stakeholders who benefit from a simple “we raised prices, so we lost customers” narrative (or its mirror, “we must cut prices to survive”) will actively discount high-diagnosticity disconfirming evidence. High-diagnosticity evidence that could be manufactured or selectively framed, and who benefits:
- Discounting E4 usage-decay as “customers knew the price was rising and prepared to leave,” rather than acknowledging value failure (H2/H3). This protects H1.
- Discounting E5 steady acquisition as reflecting “different elasticity in new markets,” insulating H1 from contradictory macro data. This protects H1.
- Discounting E9, E10, and E11 (CSM/support/tech failures) as “edge cases” without quantifying their prevalence, blocking cohort-specific elimination. This protects H1 and H2.
- Overweighting E2 “too expensive” responses at face value as ground truth. This inflates H1.
- Sales-team narrative capture: Representatives retro-frame lost deals as “too expensive” because that is the most actionable narrative (“we can win on price next time”), polluting E2, E3, and E7 in one direction. Check whether win-back notes are authored by the deal-owning rep (high motive to frame as price) or an independent save team (lower motive). This inflates H1.
- Competitor price-messaging contagion: If a competitor actively messages “we are 30% cheaper,” customer price language may be contagion rather than independent judgment. “H1 confirmed” is then partly “H5 confirmed through the price channel.” H1 and H5 are not fully separable when competitive pressure operates through pricing.
- Silent-churner selection bias: Customers who leave without engaging in win-back or exit surveys are systematically excluded from the qualitative base. This filter is non-random: silent churners are often the most frustrated (H2/H4 evidence) or most decided (H5 evidence) and have no voice in the data. The price narrative in E2, E3, and E7 represents the vocal minority.
Monitoring priorities
- H1 Pricing: Price-elasticity A/B test on the at-risk legacy cohort (directly falsifies H1 if a targeted discount does not statistically improve retention); price-event cohort retention curves; competitive price benchmarks; save-rate when a price discount is offered versus when product/service changes are offered.
- H2 Fit: Product activation rates by use case; time-to-first-value distribution; feature-adoption depth at 30/60/90 days; segment-to-use-case fit scores.
- H3 Lifecycle: Cohort usage-decay curves. Pre-billing decay confirms H2/H3; a sharp post-billing drop confirms H1.
- H4 CS/Support: Ticket volume and resolution time in the churned cohort; NPS trajectory; support-CSAT trend; save-rate correlated with proactive outreach; CSM touchpoint audits. These identify whether absent mid-cycle intervention correlates with churn.
- H5 Competitive: Win-loss rate by named competitor; feature-parity scorecard; category share-of-voice; deal-cycle loss reasons by competitor.
- H6 Technical: Technical-ticket SLA analysis. This identifies whether recurring reliability issues precede cancellation.
- H7 Null/Macro: Industry-wide churn benchmarks; segment business-cycle indicators; contract-renewal-date distribution of churn; project-end signals; win/loss multi-select reason tagging distinguishing category-elimination (H7) from feature-switch (H5) from price-too-high-for-usage (H1).
Additional considerations
Confirmation-Bias Stress-Test Framework
Because you concluded churn is a pricing problem before reviewing the data, this sequencing creates an operative confirmation bias mechanism: a conclusion anchored ahead of evidence evaluation overweights confirming signals (e.g., “they cited price”) and discounts disconfirming ones (e.g., “usage dropped months before the bill”). Furthermore, pricing is a self-blaming yet comfortable hypothesis; it implies an actionable, quick fix (lower prices, restructure tiers), whereas alternatives imply harder fixes like product roadmap changes, organizational shifts, or accepting an exogenous cycle. Bias protects this more comfortable answer.
Apply the following stress-tests as you review the data:
- Falsifiability test: Before opening the data, write down what observation would make you abandon the pricing conclusion. A standard threshold is: if churn is uncorrelated with price events, churned customers do not switch to cheaper alternatives, and win-back conversations do not center on price, the pricing conclusion must be abandoned.
- Asymmetric-scrutiny check: For each pricing-supporting item, find the strongest disconfirming reading; for each anti-pricing item, find the strongest confirming reading. Apply identical methodological standards. Watch for double standards, such as a single exit-survey “price” quote treated as strong evidence while a “support” quote is dismissed as an outlier, or “budget cuts” dismissed as post-hoc cover while “too expensive” is treated as ground truth.
- Disconfirming-search audit: Assess what activities have actually been undertaken to find evidence against pricing. If the only search was for pricing evidence, the absence of counter-evidence is an artifact, not a finding. Required data pulls include tenure distribution, churned-cohort support tickets, churned-customer NPS trajectories, macro data for the period, and a re-contacted silent-churner sample.
- Confound-structure check: “Cited price” is frequently a symptom, not the cause. Dominant chains include a product-fit gap leading to under-utilization and perceived low value, or a support failure leading to frustration and a competitive search. Treating exit-survey price mentions as direct pricing evidence without controlling for upstream causes in the same customer’s record is the dominant bias in churn analysis.
- Commitment test: Ask whether you would update your conclusion if a competitor proved meaningfully better at the same price, if the industry contracted 15%, or if churned-customer NPS had declined for six months. If you cannot answer yes to all three, the pricing conclusion is a belief, not an analysis.
Analytical Constraints and Next Actions
- Data-availability caveat: No actual churn data, exit surveys, support tickets, NPS history, billing/price-event logs, or win-loss records were provided. The matrix above is a conditional template populated from typical B2B SaaS patterns. It must be re-populated from your records to become a factual finding.
- Scope hedge: Pricing rarely produces <90-day churn in B2B SaaS contexts with annual contracts, because price-sensitive customers typically stay long enough to feel the price. This hedge is scope-bounded and may not apply to monthly-billed entry tiers, PoC-driven conversion, freemium-to-paid funnels, or aggressive introductory pricing where price exposure is front-loaded.
- Remaining gaps: Whether the seven hypotheses fully capture the landscape depends on your unspecified industry, product type, and segment mix. The consistency of “found a cheaper alternative” with the null/macro hypothesis may shift upon inspection of actual exit-survey text (e.g., category-eliminating customers may phrase it as “budget eliminated”). Furthermore, high-diagnosticity rows are justified in this template, but lower-diagnosticity rows carry stated but not per-cell-reasoned ratings. The magnitude of silent-churner bias depends on your exit-survey and win-back engagement rates.
- Next action: Replace the illustrative evidence metrics with your actual dataset metrics and rerun the evaluation, starting with price-event correlation (E1) and pre-churn usage trajectory (E4). If the pricing hypothesis still accumulates the highest I+II count, the pricing conclusion must be abandoned. Pull and re-engage a sample of silent-churner customers before relying on the exit-survey distribution.
(visual rendered — see artifact)
Before the matrix, one thing has to be said plainly about the setup. Your stated order — “I’ve already concluded our churn is fundamentally a pricing problem, and now I’m reviewing the data” — is the confirmation-bias signature in pure form: conclusion first, data second, with the review positioned to confirm a fixed prior rather than to discriminate among rivals. The bias audit you’ve already drafted is the right instinct; what follows is its formal backbone — an actual hypothesis-by-evidence matrix that rates evidence across the rival explanations and computes an elimination tally, which the earlier pass never built (it listed disconfirming tests without scoring them).
Two honesty constraints govern everything below.
No actual churn data was supplied. No usage numbers, tier-churn breakdowns, exit-reason tallies, NPS, or competitor prices are in front of this analysis, and none have been invented. The deliverable is the instrument: the hypothesis set, the diagnostic core, the matrix structure, and a scoring kit you run against real numbers. Every populated cell reading is an explicitly illustrative placeholder (marked ⚑); the verdict is conditional on your substituting real values.
Two legitimate ways to build this matrix are in play, and they diverge — that divergence is the load-bearing finding here, not noise to smooth over. One construction populates each cell with the consistency of an illustrative reading against each hypothesis (call it the illustrative-reading set). The other keeps each cell as the predicted consistency if the finding were observed true and refuses to populate readings at all (the conditional-consistency set). The arithmetic differs precisely because of this, so the elimination tally is computed twice. A sub-tension rides on the uncollected, manufacture-prone self-report rows (probed exit reasons; NPS-at-churn): the illustrative construction marks them NA, holding that assigning a convenient value to absent data manufactures a conclusion — confirmation bias run in reverse — while the conditional construction rates them but flags them lowest-credibility. Both treatments are kept; the disagreement is a real methodological choice.
One precision caveat is load-bearing and easy to get backwards: pricing is not less likely to be true than the alternatives — it is no better grounded than they are. On confirmed evidence, all hypotheses are equally unsupported right now. What the evidence does not yet earn is your confidence in pricing, not pricing’s plausibility. Treating “you concluded it first” as evidence against pricing would be confirmation bias wearing the opposite jersey. And the word “fundamentally” is itself a single-lever premise the disconfirmation discipline has to reach: the most common truth in churn is that no single lever dominates, which is why the multifactorial and null hypotheses below are standing reminders the data may be saying “heterogeneous — segment rather than hunt one root.”
Hypothesis list
- H1 — Pricing (user-proposed): price level, structure, or sensitivity is the dominant churn driver — customers got value but couldn’t justify ongoing cost.
- H2 — Product-fit / segment mismatch (analyst-generated): the product doesn’t solve the core job for these accounts; usage low or absent.
- H3 — Execution / support quality (analyst-generated): onboarding friction, bugs, thin support drive exits.
- H4 — Value-realization / time-to-value failure (analyst-generated): ROI arrives too slowly relative to the payback window.
- H5 — Competitive-capability displacement (analyst-generated): customers left for a better-featured or more-reliable rival at equal-or-higher price.
- H6 — Involuntary / contractual churn (analyst-generated): failed payments, renewal admin, billing friction. Mechanistically distinct — it produces churn at high usage and high NPS, which no other hypothesis predicts; your bias would misfile it as “didn’t renew → price.”
- H7 — Relationship / champion decay (analyst-generated): the key internal sponsor left and the account lost its champion.
- H8 — Multi-factor / no single lever (analyst-generated): churn is a blend of the modeled causes with no dominant one. The sharpest direct threat to the “fundamentally” framing.
- H0 — Null / unmodeled (analyst-generated null): no single dominant modeled lever; churn sits near a heterogeneous baseline driven by out-of-model causes (champion turnover, macro budget cuts, M&A, billing/contract friction). The parsimony floor every other hypothesis must beat.
A structural tension runs through the “other causes” space: one construction treats involuntary churn (H6) and champion decay (H7) as standalone hypotheses; the other folds champion turnover and billing friction into the null bucket (H0) and instead elevates H8 (“multi-factor, no single lever”) as the explicit anti-”fundamental” hypothesis. Both carvings survive with provenance noted — the analysis cannot resolve from available content which is correct.
Evidence inventory
- E1 — Pre-churn final-30-day usage trajectory (telemetry; High cred / High rel): ⚑ ~30% near-zero, the rest declining gradually rather than high-plateaued. Diagnostic core.
- E2 — Churn rate by price tier, company size held constant (billing + CRM firmographics; High / Very high): ⚑ flat across tiers, with small size dominating. Diagnostic core; the native test of H1.
- E3 — Probed exit reasons — capability/feature gaps vs price, pushed past the first answer (customer interviews; Low–Med / High): NA under the illustrative construction (not yet structured-probed, manufacture-prone); rated under the conditional construction with a lowest-credibility flag.
- E4 — Churn timing: a 60–90-day post-onboarding cliff vs renewal-timed (CRM lifecycle + telemetry; High / Med–High): ⚑ clusters 60–90 days post-onboard, plus a smaller renewal cluster.
- E5 — Price point of the competitor departing customers chose (win/loss + customer confirmation; Med–High / Very high): ⚑ equal-or-higher priced than incumbent. Diagnostic core; single most discriminating datum.
- E6 — NPS / satisfaction at the churn decision (customer self-report; Low / Med): NA (not yet collected) — the decisive test for H6 when collected.
- E7 — Retention vs CS/onboarding-success engagement (telemetry / CRM; High / Med): ⚑ success-engaged customers retain markedly better.
- E8 — Churn baseline before the Q3 price change (historical billing / renewal; High / High): ⚑ already elevated, with a modest step after.
- E9 — High sustained usage (≥4 hr/wk) right up to cancellation (telemetry; High / Very high): the inverse signature of E1.
- E10 — Driver/regression: one factor accounts for the majority of churn variance (combined-dataset driver analysis; Med / High): the only falsifier for H8.
- E11 — Churn roughly uniform across onboarding cohorts and tenure — no cliff, no renewal spike (CRM lifecycle; High / High).
- E12 — Champion-departure accounts over-represented in churn (CRM contact/activity logs; High / High): an evidence row in one construction; the mechanism of H7 in the other — same fact, two structural placements.
- E13 — At-risk discount save-experiment (— / High): NA (not run) — the single cleanest unrun test of H1.
Consistency matrix
Read across each row. Legend: CC very consistent · C consistent · N neutral · I inconsistent · II very inconsistent · NA not applicable. Where the two constructions diverge, the cell reads illustrative | conditional and is marked ⚠.
| Evidence | H1 Price | H2 Fit | H3 Exec | H4 Value | H5 Compet | H6 Invol | H7 Champion | H8 Multi | H0 Null |
|---|
| E1 near-zero usage | I | CC | C | C | I | I | C | C | C | N ⚠ |
| E2 churn × price-tier (size held) | II | CC ⚠ | C | N ⚠ | C | N ⚠ | C | N ⚠ | N | N | N | C | C | I ⚠ |
| E3 probed exit reasons | NA | II ⚠ | NA | C | NA | N | NA | C | NA | CC | NA | NA | C | NA | N |
| E4 60–90d onboarding cliff | I | C | CC | CC | N | C | N | C | N |
| E5 competitor equal/higher price | II | N | C ⚠ | N | C ⚠ | N | CC | I | N | C | N |
| E6 NPS at churn | NA | NA | NA | NA | NA | NA | NA | NA | NA |
| E7 success-engagement retention | I | I | CC | CC | N | C | CC | — | C |
| E8 pre-change churn baseline | I | II ⚠ | C | C | C | C | C | C | C | CC | C ⚠ |
| E9 high sustained usage to cancel | CC | I | N | I | C | — | — | C | C |
| E10 one factor = majority variance | C | C | C | C | C | — | — | I | C |
| E11 uniform churn (no cliff) | N | N | I | I | C | — | — | CC | C |
| E12 champion-departure over-rep | N | N | C | N | N | — | (is H7) | C | CC* |
* E12/H0 is CC by partial definitional overlap — the null bucket was defined to include champion turnover, so it confirms by construction and carries little independent diagnostic weight. Read it as “consistent with the null bucket,” not a discriminating win.
The marked cell-tensions, preserved rather than collapsed:
- E2/H1 — II vs CC is the deepest tension and the root of the whole divergence. Under an illustrative “flat across tiers” reading the cell contradicts pricing (II); under an “if churn rises as tier falls” conditional reading it confirms pricing (CC). The E2 row’s H2/H3/H4 and H0 cells diverge for the same reason: the illustrative-flat reading reads C for the non-pricing causes and C for null, while the conditional reading reads N for the rivals and I for null.
- E3 whole-row — NA vs rated: refuse-to-populate (manufacture-prone self-report) vs rate-but-discount-credibility.
- E5/H2 and E5/H3 — N vs C: divergence on whether an equal/higher-priced competitor is neutral toward, or mildly consistent with, the fit and execution stories.
- E8/H1 — I vs II and E8/H0 — CC vs C: divergence on how severely a pre-change baseline contradicts the price-change causal story.
Diagnosticity assessment
- E2 (churn × price-tier, size held constant) — highest diagnosticity for the pricing question. The only row where H1 can score CC while most rivals sit at N; the single cleanest discriminator between “it’s price” and “it’s something correlated with small accounts.” A pricing-driven world requires churn to rise with price point independent of size. If you run one test, run this.
- E5 (competitor’s price) — highest single discriminator overall. It separates H1 (II), H5 (CC), and H6 (I) in one observation. If departing customers paid the same or more elsewhere, pricing takes a direct hit and competitive-capability gets direct support.
- E1/E9 (usage trajectory) — high diagnosticity as a matched pair, and a two-for-one pivot. Near-zero usage (E1) is the signature of fit/value failure and is inconsistent with pricing-as-dominant — you can’t be too expensive for a product never used. High sustained usage to cancellation (E9) is the inverse: inconsistent with fit (H2) and value (H4), the classic price/competitive signature. One of E1/E9 will be true; whichever it is points hard.
- E10 (single-factor regression) — highest diagnosticity against H8 specifically. The only row that can disconfirm “no single lever,” which removes H8’s former unfalsifiability.
- E8 (pre-change baseline) — diagnostic against the specific causal story that the Q3 increase drove the spike, but it dings only H1 — low cross-discrimination, so don’t lean on it alone.
- Low-diagnosticity: E12/H0 is near-tautological (definitional overlap). The two NA self-report rows (E3, E6), once collected, must be cross-checked against telemetry before earning weight.
- No row is flat across all columns — the matrix genuinely discriminates on data, not on prior.
Tentative conclusions via elimination
The elimination tally is computed twice because the two constructions count different evidence inventories. I+II is the contradiction count; II is the tie-breaker.
Under the illustrative-reading construction (populated rows E1, E2, E4, E5, E7, E8; E3/E6/E13 marked NA):
| Hypothesis | I | II | I+II |
|---|
| H1 Pricing | 4 | 2 | 6 ← most contradicted |
| H6 Involuntary | 2 | 0 | 2 |
| H2 Product-fit | 1 | 0 | 1 |
| H5 Competitive | 1 | 0 | 1 |
| H3 Execution | 0 | 0 | 0 |
| H4 Value-realization | 0 | 0 | 0 |
| H7 Champion | 0 | 0 | 0 |
| H0 Null | 0 | 0 | 0 |
H1 is eliminated as the most contradicted hypothesis (I+II = 6) — the inverse of your starting point, which is exactly what ACH surfaces when the favoured hypothesis loses. No single winner is named: four hypotheses tie at zero contradictions (H3, H4, H7, H0). Breaking the tie on positive exposure (CC count), H3 (execution) and H4 (value-realization) lead at 2 CC each and are indistinguishable on current readings. H0 survives only by being compatible with everything — that is its weakness, the floor to beat, not a result.
Under the conditional-consistency construction (“matrix-as-drawn” potential I+II = exposure, since zero cells are confirmed):
| H1 | H2 | H3 | H4 | H5 | H6/H8 | H0 |
|---|
| Potential I+II | 5 (2 I + 3 II) | 1 | 1 | 2 | 1 | 1 | 1 |
The verdict is underdetermined today. Zero cells are confirmed true, so no hypothesis can be eliminated and the null cannot be rejected — the strict ACH survivor right now is “insufficient evidence.” But H1 is the most exposed hypothesis (5 of 10 rows can disconfirm it) — the most falsifiable claim on the board, which is exactly why a conclusion-first commitment to it is the riskiest stance. The multi-factor hypothesis now carries one exposure cell (E10), so it is no longer an unfalsifiable auto-winner.
Reconciling the two counts (this is not a tally error): the “6” and the “5” count different evidence inventories. The illustrative tally runs E1/E2/E4/E5/E7/E8 → I, II, I, II, I, I = 6. The conditional construction’s H1 inconsistencies are E1/E3/E4/E5/E6 → 2 I + 3 II = 5. Both are internally correct. (Separately, an earlier scenario miscount of “6” within the conditional construction was corrected to the right value of 5.) Both constructions converge on the central finding: pricing is the hypothesis most vulnerable to disconfirmation. Both also deliberately reframe “least supported” into “most contradicted / most exposed,” reserving “support” language for CC and diagnosticity — which closes the inverse-confirmation-framing trap.
Two bracketing scenarios show the matrix discriminates on data, not prior:
- Anti-pricing battery (E1, E3, E4, E5, E6 against price; E9 false): H1 → I+II = 5 (2 I + 3 II), eliminated; survivors H2/H3/H4/H8/H0 at 0. Robustness check: H1’s load includes a II from low-credibility E3 — discount E3 entirely and H1 still carries 4, eliminated even after dropping the row the analysis itself distrusts.
- Pro-pricing battery (E2 confirms tier-slope; E9 high usage; E3 reversed; E4 renewal-timed; E8 stable-then-jumped; E5 cheaper; E10 one factor): H1 → I+II = 0, survives; the inconsistency load shifts to H4 (2) and H5 (2), with a single I on H8 (E10 shows a dominant factor).
Two caveats temper the tally. H1’s contradictions are not independent strikes. E1 (low usage) and E7 (engagement-sensitive retention) co-move as one underlying usage/engagement signal appearing twice; the independent core of H1’s contradiction is the two diagnostic II’s (E2, E5) plus the usage cluster. Read it as “two clean diagnostic hits plus a usage cluster,” not “six strikes” — and note that the verdict survives the discount: even reduced to its diagnostic core, pricing still leads the contradiction count. And H3 and H4 tie because they share their support — both draw their CC from E4 (early churn) and E7 (engagement saves), and neither row discriminates execution from value-realization. The rows that would split them, E3 (probed exit reasons) and E6 (NPS), are exactly the two not yet collected. That is not coincidence; it is the shape of the evidence gap.
Sensitivity analysis
- E2 is the pivot. If churn tracks company size, not price tier (E2 → I for H1), H1 loses its only strong positive and gains an inconsistency — contender to eliminated in one move. A clean E2 = CC is the only finding that can carry H1 on its own.
- E5 reallocates H1 vs H5. Switchers went cheaper → E5 CC for H1, I for H5; equal/higher → reverse. One row decides which “they left us” story wins.
- E1/E9 flips H1 vs H2/H4. High sustained usage simultaneously supports H1 and pushes I onto H2 and H4; near-zero usage does the opposite — a two-for-one pivot.
- E4 survivor-flip (the cheapest). Reverse E4 to “churn evenly distributed, no onboarding cluster”: H3 and H4 each lose their E4 CC and gain an inconsistency (rising to I+II = 1), making H7 and H0 the sole survivors. One timing reading decides whether the problem is a named, stage-specific one or a diffuse one.
- E10 is the pivot for H8. No dominant factor → H8 keeps its zero; a dominant factor → H8 takes an I and loses its “no single lever” claim.
- E8 alone can sink the price-change narrative. Confirmed pre-change elevation turns E8 to II for H1 regardless of everything else.
- What pricing needs to actually win. The pro-pricing trifecta — E1 (high plateaued usage) + E2 (churn rises with tier) + E5 (left for cheaper) — drops H1 from 6 to 3: competitive, but still not a survivor, because E4 (timing), E7 (engagement), and E8 (baseline) keep contradicting. Making pricing the actual winner needs those three to read pro-pricing too — five-plus readings, not three — an honest measure of how far the current evidence structure sits from your conclusion. Decision rule: collect E1, E2, E5 first; if even one comes back against price, stop building the pricing case.
Deception assessment
There’s no external adversary planting evidence here, so the deception check is reframed to its apt analog: internal evidence-manufacture. Three evidence-corruption channels exist, all biased toward H1 — which is precisely why pricing “feels” supported.
- Self-report channels (E3, E6) are cheap to manufacture and point at H1. “Too expensive” is the lowest-friction, most face-saving exit reason — socially safe in a way “I couldn’t get it working” or “your support was slow” is not; it exonerates the customer and spares your product and CS teams. The one datum that would most support pricing is the one most likely to be a polite fabrication. This is why one construction marks E3/E6 NA and the other flags E3 lowest-credibility. The asymmetry — the cheapest, most-available evidence corrupted in the direction of the conclusion — is itself diagnostic. De-biasing protocol: probe past the first answer (“what specifically did you switch to, and what did it do that we didn’t?”); weight hard, un-spinnable telemetry (E1, E2, E9, E12) above narrated reasons.
- Organizational advocacy. Whoever owns pricing has an incentive to surface pricing evidence; sales and CS prefer “lost on price” (blames the price list) over “lost on our slow onboarding” (blames them). Internally-sourced loss reasons skew toward H1/H5 and away from H3. Source loss-reason data from the customer, not the account owner — and discount the provenance if the “pricing problem” framing originated with the team that would act on a price change.
- Self-manufacture. Your own pre-data conclusion is the same mechanism turned inward — it pre-loads which evidence feels salient. The bias audit you’ve already drafted is the right instinct; this matrix is its formal backbone.
Monitoring priorities
- If H3/H4 hold (the current surviving field): time-to-first-value by segment vs contract length (payback-window compression); share of accounts reaching the “aha”/best-fit feature within 30/60/90 days; onboarding-completion vs subsequent retention (which separates execution from value-realization once E3/E6 are in).
- If data promotes H1 (pricing): churn-rate slope across price tiers, size-controlled (should steepen at higher tiers); the E13 discount save-experiment — the single cleanest unrun test (offer 20% to 8–10 at-risk accounts; if most leave anyway, price wasn’t the lever); downgrade-before-cancel rate (price-sensitive customers step down before they leave).
- If H6 surfaces (involuntary): failed-payment / dunning-recovery rate and renewal-admin drop-off — churn at high usage + high NPS is its signature, and E6, once collected, is its decisive test.
- For H2 (fit): E1/E9 usage trajectory — flag both the near-zero-usage share and the high-sustained-to-cancel share.
- For H5 (competitive): E5 — destination competitor, their price point, and the specific capability cited.
- For H8 (multi-factor): E10 driver/regression — one factor exceeding the majority of variance disconfirms H8; if no factor dominates, H8 is the answer.
- For H0/H7 (null/champion): champion-departure flag (E12) in CRM cross-referenced against churn; budget-cut / M&A flags from account notes.
- Cross-cutting: collect the NA rows — E3 and E6 via structured, telemetry-cross-checked probing; run E13. Re-score E1, E2, E5 with hard telemetry (not exit interviews) monthly — those three move the verdict more than all others combined.
Additional considerations
The actionable answer may be an interaction, not a single lever. H3 (execution) and H4 (value-realization) are indistinguishable in this matrix precisely because they compound: thin onboarding (H3) delays time-to-value (H4), which the customer then rationalizes as “too expensive” (the H1 mirage). The most useful read of the whole matrix may be H3 × H4 as a coupled mechanism, not a contest one of them wins. And if a driver analysis (E10) shows no factor exceeding the majority of variance, then “fundamentally a pricing problem” is a category error, not a near-miss — the right next step is segmenting rather than hunting for one root.
Five residual uncertainties bound the confidence of this instrument:
- Deception-check scope. The mode’s deception check targets external adversarial actors; with none present, an internal evidence-provenance / self-report-manufacturing channel was substituted. The substitution is judged apt, but it is uncertain whether the mode intends internal advocacy to satisfy that check rather than a not-applicable mark.
- Tie resolution. The II tie-breaker does not separate the zero-contradiction survivors (H3, H4, H7, H0 under the illustrative construction). The tie was broken on positive CC exposure (H3 and H4 leading at 2 CC each), and no single hypothesis was crowned. Whether non-arithmetic (CC-exposure / parsimony) tie resolution is fully gate-compliant is unresolved.
- Verdict conditionality. The matrix is an instrument, not a reading of your actual data; the verdict resolves only when real E1/E2/E5 values are substituted.
- Disconfirmer availability. Whether balanced, measurable disconfirmers for H2–H4 actually exist depends on instrumentation not visible here (what telemetry / CRM / billing fields you have). E9/E10/E11 are the named disconfirmers, but their data may not all be collectable.
- E12/H7 orthogonality. Whether champion departure is genuinely orthogonal to price, or can co-occur with it, requires account-level data on whether champion-driven and price-driven churn overlap.
(visual rendered — see artifact)