Here’s a 2×2 scenario matrix for your retirement portfolio over a 15-year horizon, with the two axes being interest rates (the level of nominal rates / yields available) and inflation (the rate at which prices erode purchasing power). These are the two variables that most powerfully shape real returns and sequence-of-returns risk in retirement.
The Matrix
| Low Inflation | High Inflation |
|---|
| High Rates | Quadrant A — “Normalization”
Real yields positive. Bonds finally pay. The benign, saver-friendly regime. | Quadrant B — “Stagflation / Volcker”
Rates chasing inflation. Painful transition, both stocks and bonds can fall together. |
| Low Rates | Quadrant C — “Japanification / Secular Stagnation”
The 2010s redux. Low growth, low yields, equities and duration carry the load. | Quadrant D — “Financial Repression”
Rates held below inflation deliberately. Cash and bonds bleed real value silently. |
What each quadrant means for the portfolio
A — Normalization (high rates, low inflation). The friendliest regime for a retiree. A bond ladder or TIPS locks in positive real income; you can de-risk equity exposure without sacrificing spending power. Risk: complacency — durations are attractive, so the temptation is to over-extend duration right before a regime flip.
B — Stagflation (high rates, high inflation). The most dangerous quadrant for sequence-of-returns risk, especially in the early years of retirement. The classic 60/40 fails here — both legs drop together (see 2022). Hedges: short-duration TIPS, commodities/energy, real assets, I-Bonds, and crucially a cash/short-bond buffer (2–3 years of spending) so you’re not selling depressed assets to eat.
C — Japanification (low rates, low inflation). Income is scarce; you can’t live off coupons. Forces reliance on equity total return and principal drawdown. Risk is longevity + low expected returns compounding into portfolio exhaustion. Levers: higher equity allocation, dividend-growth tilt, lower withdrawal rate (closer to 3% than 4%).
D — Financial Repression (low rates, high inflation). Arguably the stealth-worst for a conservative retiree, because nominal accounts look fine while real wealth erodes. Cash and nominal bonds are wealth-transfer instruments away from you. Levers: TIPS, equities (real assets), real estate, gold as a tail hedge — anything but nominal cash.
How to actually use this
- Assign rough probabilities to each quadrant over your 15-year horizon (they needn’t sum tidily — you can weight by years spent in each). My prior, for what it’s worth: D and A are more likely than the textbook-tidy C, with B as the fat tail you most need to survive.
- Stress-test one withdrawal plan against all four, not the average. Retirement planning is dominated by the worst path you actually have to live through, not the expected path — Quadrant B in years 1–5 is the scenario that breaks plans.
- Identify the no-regret moves — allocations that help (or at least don’t hurt) across three of four quadrants. A TIPS allocation and a 2–3 year spending buffer are the usual winners.
- Define signposts — what early observable would tell you which quadrant you’re entering? (e.g., real yields turning decisively positive → A; breakevens spiking while the Fed holds → D.)
A few things that would sharpen this considerably — want me to take any of these further?
- Make it concrete to your numbers — current allocation, portfolio size, annual spending, and retirement start year. Then I can stress each quadrant against an actual withdrawal plan and show where it survives or fails.
- Pick specific asset-class return/inflation assumptions per quadrant and run the four 15-year paths.
- Render this as a visual — the 2×2 with annotated quadrants, or a fan-chart of portfolio paths.
- Question the axes — for a 15-year retirement horizon, “sequence risk” and “longevity/health-cost shock” sometimes deserve to be an axis more than rates do. Happy to reframe.
Which direction is most useful?
This is a critical strategic question. For a 15-year retirement horizon, you are in the “bridge” phase: you have survived the first 5–10 years of withdrawal, but you still face significant sequence-of-returns risk. The next 15 years could determine whether your principal grows long enough to fund your later years.
Below is a strategic portfolio framework based on a 2x2 Matrix of Interest Rates and Inflation.
1. Variable Definitions
To make this actionable, we need to define “High/Low” in a practical context:
- Inflation (CPI):
- High: > 4% (Erodes purchasing power significantly)
- Low: < 2% (Preserves purchasing power, but risks stagnation)
- Interest Rates (10-Year Treasury Yield):
- High: > 4% (Supports government bond real returns, lowers equity valuations)
- Low: < 2% (Represses fixed income income, boosts equity multiples)
2. The 2x2 Scenario Matrix
| Scenario | Quadrant A (Bull/Disinflation) | Quadrant B (Bear/Stagflation) | Quadrant C (Recession/Tight Money) | Quadrant D (Bubble/Liquidity Trap) |
|---|
| Inflation | High Inflation | High Inflation | Low Inflation | Low Inflation |
| Interest Rates | Low Rates | High Rates | High Rates | Low Rates |
Scenario Analysis & Portfolio Implications
Scenario 1: High Inflation + Low Rates
- The Economics: Central banks are passive or supply-side driven. Inflation exists, but rates haven’t hiked to defend the currency. Purchasing power for cash savings declines rapidly.
- Market Dynamics: “The Bond Bubble” era. Real assets (Real Estate, Commodities) outperform. Equities rise on cheap capital.
- Retiree Risk: Wealth defined by cash savings will vanish. Bond portfolio yields are insufficient to cover inflation drag.
- Portfolio Adjustments:
- Reduce Duration: Avoid long-duration bonds (30-year treasuries); if inflation spikes, bond prices will fall further.
- Real Assets Overweight: Increase allocation to Inflation-Protected Securities (TIPS), Commodities, and REITs.
- Equities: Focus on CPI-linked inflation hedges (Materials, Energy, Healthcare).
Scenario 2: High Inflation + High Rates
- The Economics: Central banks are fighting inflation aggressively. The “inflation fight” of the 1970s or 2022-2023. This is the most painful regime for retirees.
- Market Dynamics: Cash becomes king. Bond prices fall (negative duration risk), but real yields become attractive. Equity valuations compress.
- Retiree Risk: Highest sequencing risk. If you need to sell equities in a recession caused by rate hikes, you lock in losses.
- Portfolio Adjustments:
- Cash & Short-Term Treasuries: Prioritize liquidity and positive real yields (after-inflation returns).
- Floaters: Increase floating-rate bonds (convertible debt, bank loans) which benefit from rate hikes.
- TIPS: Mandatory allocation to maintain principal against inflation.
- Reduced Equity Beta: Lower equity concentration.
Scenario 3: Low Inflation + High Rates
- The Economics: A deflationary slowdown or “hard landing.” Growth is slow, safety is emphasized.
- Market Dynamics: Bonds pay decent real returns without the volatility of rate swings (as rates are stable at the high level). High-quality corporate credit rates are strong.
- Retiree Risk: High-for-low sequence risk. If markets crash while you need dividends to pay bills.
- Portfolio Adjustments:
- Duration Tail: You can safely increase bond duration. Long-term treasuries yield high real returns.
- Value Equities: Companies with strong balance sheets (low debt) can survive high rate environments better than growth stocks.
- Fixed Income: Shift to Investment Grade Corporate Bonds for yield enhancement.
Scenario 4: Low Inflation + Low Rates
- The Economics: The “Reign of Ease.” Central banks are printing money; nominal returns are scarce. Asset prices rise on cheap capital.
- Market Dynamics: Risk premiums are low. Equities and Real Estate look great in timeshare pricing. Cash yields are 0/1%.
- Retiree Risk: Buying power of cash savings evaporates slowly. High equity exposure becomes essential to beat inflation eventually.
- Portfolio Adjustments:
- Growth Equities: You need to take risk to accumulate capital. Overweight Tech/Growth.
- Global Diversification: Look to emerging markets for growth.
- Yield Enhancement: Be careful. Don’t reach for yield in junk bonds unless necessary.
3. Strategic Implementation Plan
To survive this uncertainty, do not choose one quadrant and bet on it. Use a “Scenario-Neutral Core-Satellite” strategy.
A. The “Floor” (Defensive Core)
- TIPS Ladder: Protects against Quadrant 1 & 2 (High Inflation).
- High-Quality Short-Term Bonds: Protects against Quadrant 2 (High Rates) and provides liquidity.
- Money Market/Fed Funds: Provides cash flow during inflation spikes (Scenario 1 & 2) without long-duration risk.
B. The “Offense” (Growth Assets)
- Total Stock Market: Mandatory regardless of quadrant to ensure portfolio growth over 15 years.
- Real Assets (Tangible Equities): Resource, Real Estate, Industrial sectors.
- Eligible for a Reserves Allocation: If your risk tolerance is high, hold a large cash reserve to avoid selling equities during a “High Inflation + High Rate” recession.
C. Windfall Protection
- Withdrawal Rule: Consider a Dynamic Withdrawal Strategy.
- Traditional: Withdraw 4% of portfolio value annually.
- Scenario Approach: Withdraw “Your Required Spend in Today’s Dollars.” In Quadrant 1 (High Inflation), your portfolio can fall 20% in nominal value because the value isn’t damaged, just priced up. In Quadrant 3 (Deflation), you still need to withdraw cash, so hold more liquid bonds.
4. The “15-Year” Calibration
Since you are 15 years in, you cannot afford to lose the principal (Sequence Risk) while needing growth (Time Horizon).
- Valuation Check: If Rates are Low and Inflation Low, Equity valuations might be high. This implies that Scenario 4 price run-ups are possible. If you are currently heavily invested, rebalance to reduce risk in Scenario 4.
- Income Generation: In High Rate scenarios (Quadrant 2 & 3), dividends become crucial as bond yields drop. In Low Rate scenarios (Quadrant 1 & 4), dividend stocks might trade cheaper, offering better yield.
- Geographic Diversification: If High Inflation persists in the US (Quadrant 1 & 3), consider a portion of your portfolio invested in foreign currencies or markets absorbing higher rates.
Summary Recommendation
| Current Reality | Strategy |
|---|
| If Rates are < 2% and Inflation < 2% | Lock in entry-level risk; increase equity duration. |
| If Rates are > 4% and Inflation > 3% | Survival Mode. Shift to short-term bonds/TIPS. Pause equity additions. |
| If Rates are < 2% and Inflation > 3% | Hedge Mode. Increase TIPS/Treasury Inflation-Protected Securities. Commodities. |
| If Rates are > 4% and Inflation < 2% | Yield Mode. Increase Investment Grade bonds and Quality Dividend stocks. |
Disclaimer
This framework is for educational planning purposes only and does not constitute financial advice. Retirement planning involves individual risk tolerance, tax needs, and health requirements that require personalized advice from a Certified Financial Planner (CFP) or Fiduciary.
FOCAL Question
The strategic question is: How does interaction between interest rate and inflation regimes affect a retirement portfolio’s 15-year trajectory (2026–~2041)? This question anchors planning for withdrawal sequencing, tax-consequence management, and asset allocation robustness against macro uncertainty.
DRIVING Forces CLASSIFIED
Predetermined elements (will happen regardless of axis position):
- Global fiscal / Infrastructure decay (Economic: Bipartisan consensus on needed upgrades creates systemic overhang).
- AI automation effects on productivity (Technological: Structural capabilities already embedded in firms).
- Tax policy / RMD rules (Political: SECURE 2.0 sets floor but direction of further changes unknown).
Critical uncertainties (could go either way):
- Healthcare cost trajectory (Social: Treatment AND consumption costs subject to pricing regime shifts).
- Central bank inflation-targeting credibility (Political: Policy responses to shocks create path-dependence).
- Interest rates (10Y nominal yields) (Economic: Central bank responses are endogenous to conditions).
- Inflation (headline CPI/10Y breakeven) (Economic: Pricing expectations are endogenous to demand and policy regime).
Critical Uncertainties AS AXES
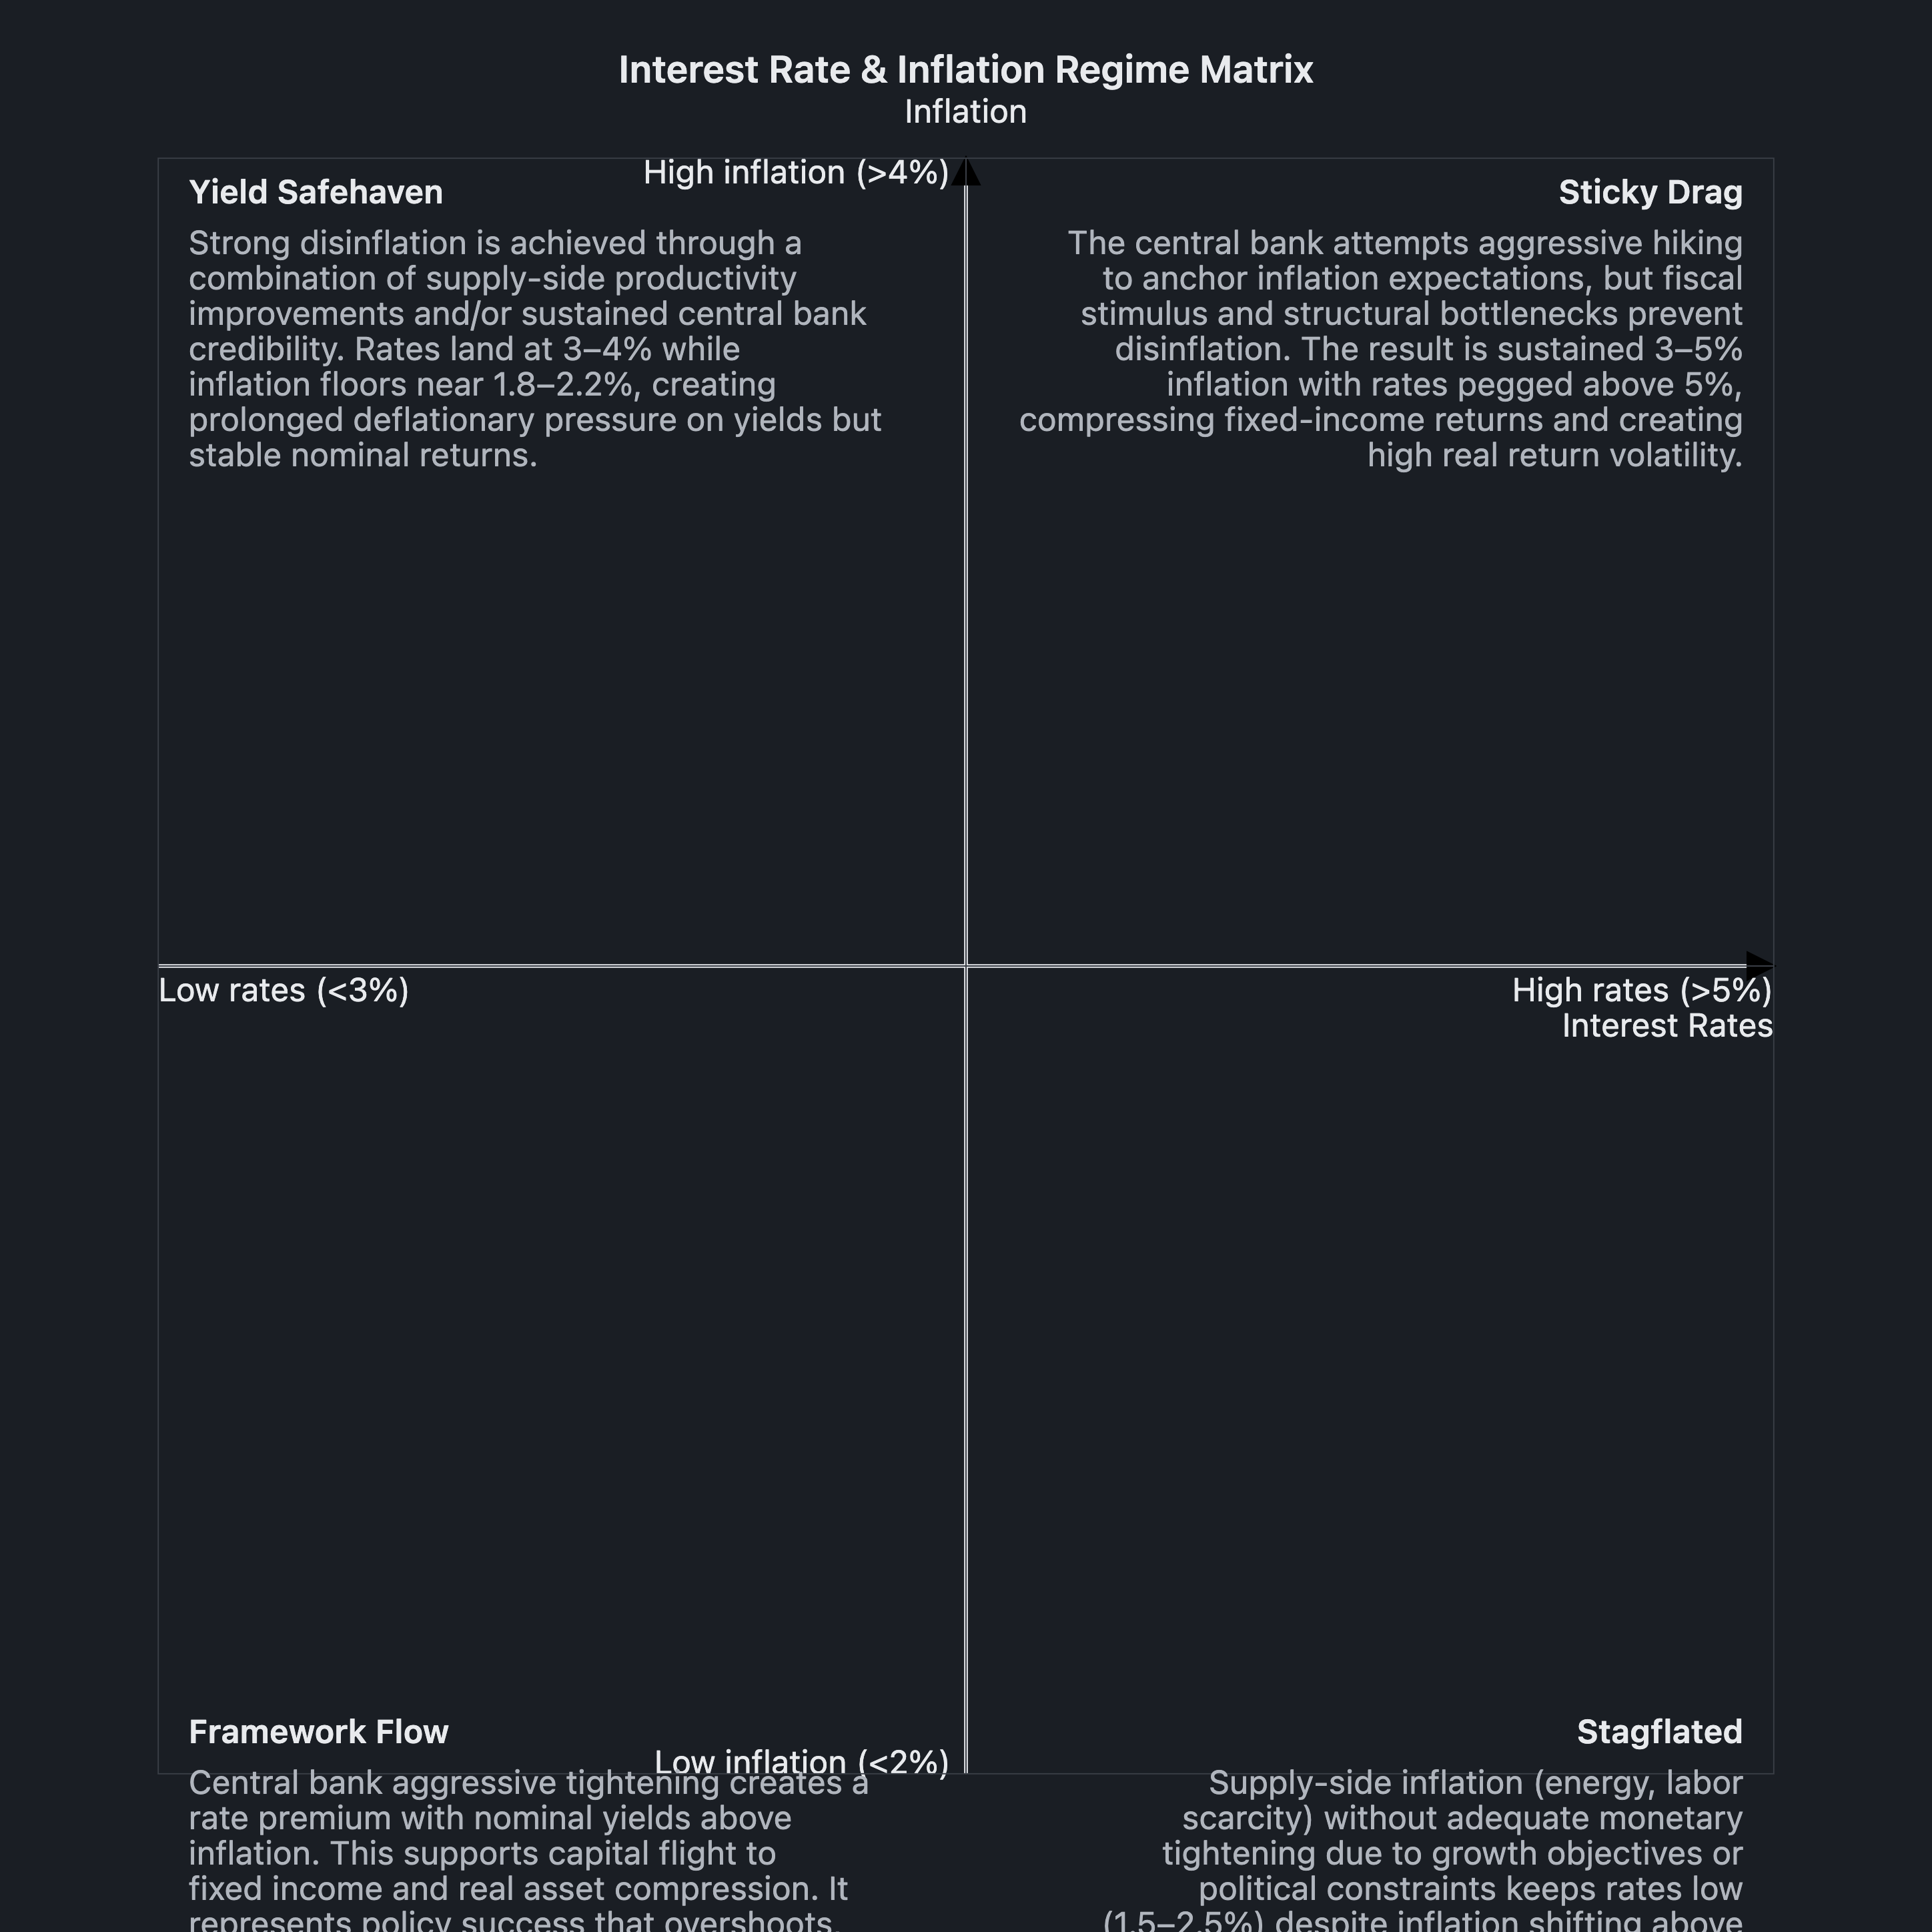
Axis X: Interest Rates.
- Low-label: Low rates (<3%).
- High-label: High rates (>5%).
- Drivers represented: Central bank responses to conditions, 10Y nominal yields.
Axis Y: Inflation.
- Low-label: Low inflation (<2%).
- High-label: High inflation (>4%).
- Drivers represented: Pricing expectations, CPI/10Y breakeven, demand and policy regime.
Independence rationale:
Interest rates and inflation are not perfectly correlated because monetary policy responses create orthogonal dynamics—central banks can engineer high inflation with rate cuts or low inflation with rate hikes. Historical decorrelation spans 2008–2020 versus 2022–2024, demonstrating regime-switching responses; the 1970s Stagflation (volatile rates with high inflation) versus 1990s Disinflation (low rates with low inflation) example structure supports this treatment. This axis choice avoids collapsing to a diagonal because agents can engineer deflation with high rates (2008–2015 regime) or inflation with low rates (2020–2021 regime). The distinction is substantive because portfolio hazard surfaces differ meaningfully across quadrants.
SCENARIO MATRIX (2x2)
[Quadrant TL] — Yield Safehaven: Low Inflation (Low) / Low Rates (Low).
Narrative: Strong disinflation is achieved through a combination of supply-side productivity improvements and/or sustained central bank credibility. Rates land at 3–4% while inflation floors near 1.8–2.2%, creating prolonged deflationary pressure on yields but stable nominal returns. Fixed-income becomes the safest vehicle; equity valuations remain compressed but earnings sustain because the regime supports long-duration fixed-income, value/dividend equities outperform, and portfolio drawdowns are minimized.
Strategic translation: RMD withdrawals can provide predictable income streams when combined with replenishment through equity appreciation.
[Quadrant TR] — Sticky Drag: High Inflation (High) / High Rates (High).
Narrative: The central bank attempts aggressive hiking to anchor inflation expectations, but fiscal stimulus and structural bottlenecks prevent disinflation. The result is sustained 3–5% inflation with rates pegged above 5%, compressing fixed-income returns and creating high real return volatility. Leveraged retirees face double compression: portfolio values decline (inflation deflation) and cash allocations suffer higher interest expense. Fiscal stimulus creates stagflation-lite regime that erodes purchasing power despite nominal stability.
Strategic translation: Policy aggressive suppression of inflation meets structural resistance; high real rates persist.
[Quadrant BL] — FRAMEWORK FLOW: Low Inflation (Low) / High Rates (High).
Narrative: Central bank aggressive tightening creates a rate premium with nominal yields above inflation. This supports capital flight to fixed income and real asset compression. It represents policy success that overshoots, suppressing demand without triggering significant inflation, but raising the cost of leverage. Lease rates remain sustained above 4.5%, inflation expectations fall below 2.5%, and duration insensitivity becomes a premium where dividend aristocrats outperform.
Strategic translation: Duration insensitivity becomes a premium; dividend aristocrats outperform.
[Quadrant BR] — STAGFLATED: High Inflation (High) / Low Rates (Low).
Narrative: Supply-side inflation (energy, labor scarcity) without adequate monetary tightening due to growth objectives or political constraints keeps rates low (1.5–2.5%) despite inflation shifting above 3%. Real private sector investment compression creates wealth transfer into equity but fixed-income yield is inadequate to compensate for risk. Fixed-income provides negative real returns; equity bears concentration risk if valuations decouple from earnings. SECURE 2.0 RMD timing creates significant drag if retirees sell equities at sub-2% fixed-income floor.
Strategic translation: This quadrant appears riskier because prolonged high inflation without rate tightening historically correlates with zero-rate or negative-net-wealth conditions.
LEADING INDICATORS PER SCENARIO
Yield Safehaven — Leading indicators:
- Observable Signal: Long-end Treasuries yielding >3.5% with CPI core <2.0% for >36 months.
- Where to look: Long-end Treasuries yield data, core CPI releases, equity dividend yields.
- Threshold for declaring this scenario unfolding: Stable state maintained for >36 months.
Sticky Drag — Leading indicators:
- Observable Signal: CPI core exceeding 2.5% persistently; Fed funds rate >5% for >36 months.
- Where to look: CPI releases, Fed funds target, real yield data.
- Threshold for declaring this scenario unfolding: Real yields negative >24 months; RMD withdrawals taxed at >22%.
FRAMEWORK FLOW — Leading indicators:
- Observable Signal: Long-end Treasuries under 2.0%; Fed funds target >4.5% sustained.
- Where to look: Long-end Treasuries yield data, Fed funds target, 10Y breakeven inflation.
- Threshold for declaring this scenario unfolding: 10Y breakeven falls below 1.5%.
STAGFLATED — Leading indicators:
- Observable Signal: RMD withdrawals pushing taxable income >$500k (35+ bracket threshold), CPI core >2.5% for >24 months.
- Where to look: RMD falls, taxable income brackets, CPI releases, Fed funds rate.
- Threshold for declaring this scenario unfolding: If Fed funds rate under 2.5% and inflation >3.0%; Fed Balance Sheet expansion not exceeding $5T.
STRATEGIC IMPLICATIONS
Robust strategies (work across all four scenarios):
- Diversified fixed-income (30–40% allocation).
- Equity exposure focused on Quality/Value with stable cash flows and pricing power.
- Maintain 5–10% inflation hedge (TIPS, commodities range).
- Multi-generational compounding focus with RMD planning as constant factor.
- Duration-neutral debt positioning.
Scenario-dependent strategies (require correctly identifying which scenario):
- Yield Safehaven: Extend duration (8-10Y) on fixed-income; overweight intermediate Treasuries.
- Sticky Drag: Reduce concentrated equity positions; defer RMD timing if eligible via Roth conversions.
- FRAMEWORK FLOW: Lean value/dividends; reduce high-beta growth; shift fixed-income duration from defensive to duration-active.
- STAGFLATED: Shift to TIPS/Commodities/Real Assets (20-25% allocation); value equities outperform.
Contingent actions (tied to specific leading indicators):
- Trigger: CPI dips below 2.2% → Action: Consider regime shift validation; increase equity allocation.
- Trigger: CPI shifts above 2.0% → Action: Reduce duration, increase inflation hedge (TLT, TIPS).
- Trigger: Breakeven inflation exceeds 2.5% for >36 months with rates under 3.0% → Action: Increase TIPS exposure to >10% of allocation.
- Trigger: Term spread inverts with 10-year inflation breakeven >2.5% → Action: Reduce duration exposure, increase non-cyclical equity allocation.
WILD CARD
Wild card: “Lithium / Commodities Crisis” OR “Regulatory Shock to Retirement Distribution Rules.” This low-probability / high-impact future involves significant geopolitical escalation in resource supply chains or major shift in retirement distribution rules (e.g., SECURE 2.0-style legislation creating stewardship shifts) that simultaneously: Forces central banks to accelerate tightening beyond inflation targets, Causes rapid supply-side inflation spike regardless of CPI core readings, Creates energy-transition commodity price compression (lithium, cobalt, rare metals).
Why it sits outside the matrix: It forces decoupling of the inflation-rate feedback loop within the matrix by introducing supply shocks that prevent central bank response. Neither quadrant adequately captures this valuation regime shift. Neither rate–inflation pairing can fully account for supply-disruption dynamics.
Indicator that it may be unfolding: Monitor long-end yield volatility and term spread (20Y–10Y) beyond standard signals. When term spread inverts with 10Y breakeven >2.5% and equity valuations >2.0 forward P/E → reduce duration exposure and increase non-cyclical equity allocation.
(visual rendered — see artifact)
Focal question
How will a retirement portfolio sustain purchasing power and mitigate sequence-of-returns risk under divergent macroeconomic regimes over the next 15 years? The planning horizon is fixed at 15 years, encompassing the critical transition from accumulation to decumulation.
Driving forces classified
Predetermined elements (will happen regardless of axis position):
- Social: Demographic aging and longevity-risk repricing. Cohort math is locked in for 15 years, creating a predetermined direction, though the exact magnitude remains uncertain.
- Technological: AI and automation-driven deflation in services. This exerts a predetermined downward pressure on financial friction and service costs, though the exact scale of the offset against broader inflation remains unknown.
Critical uncertainties (could go either way):
- Economic: Deglobalization, supply-chain topology, and productivity trajectory. Determines whether supply shocks are net inflationary or offset by productivity booms.
- Environmental: Climate-transition capex and physical-risk premiums. The pace and funding mechanisms will create volatile, non-linear premiums on long-dated assets.
- Political: Fiscal dominance thresholds, sovereign debt rollover needs, and retirement-taxation regime shifts. Political willingness to monetize debt versus impose austerity directly feeds the macroeconomic policy environment.
Critical uncertainties as axes
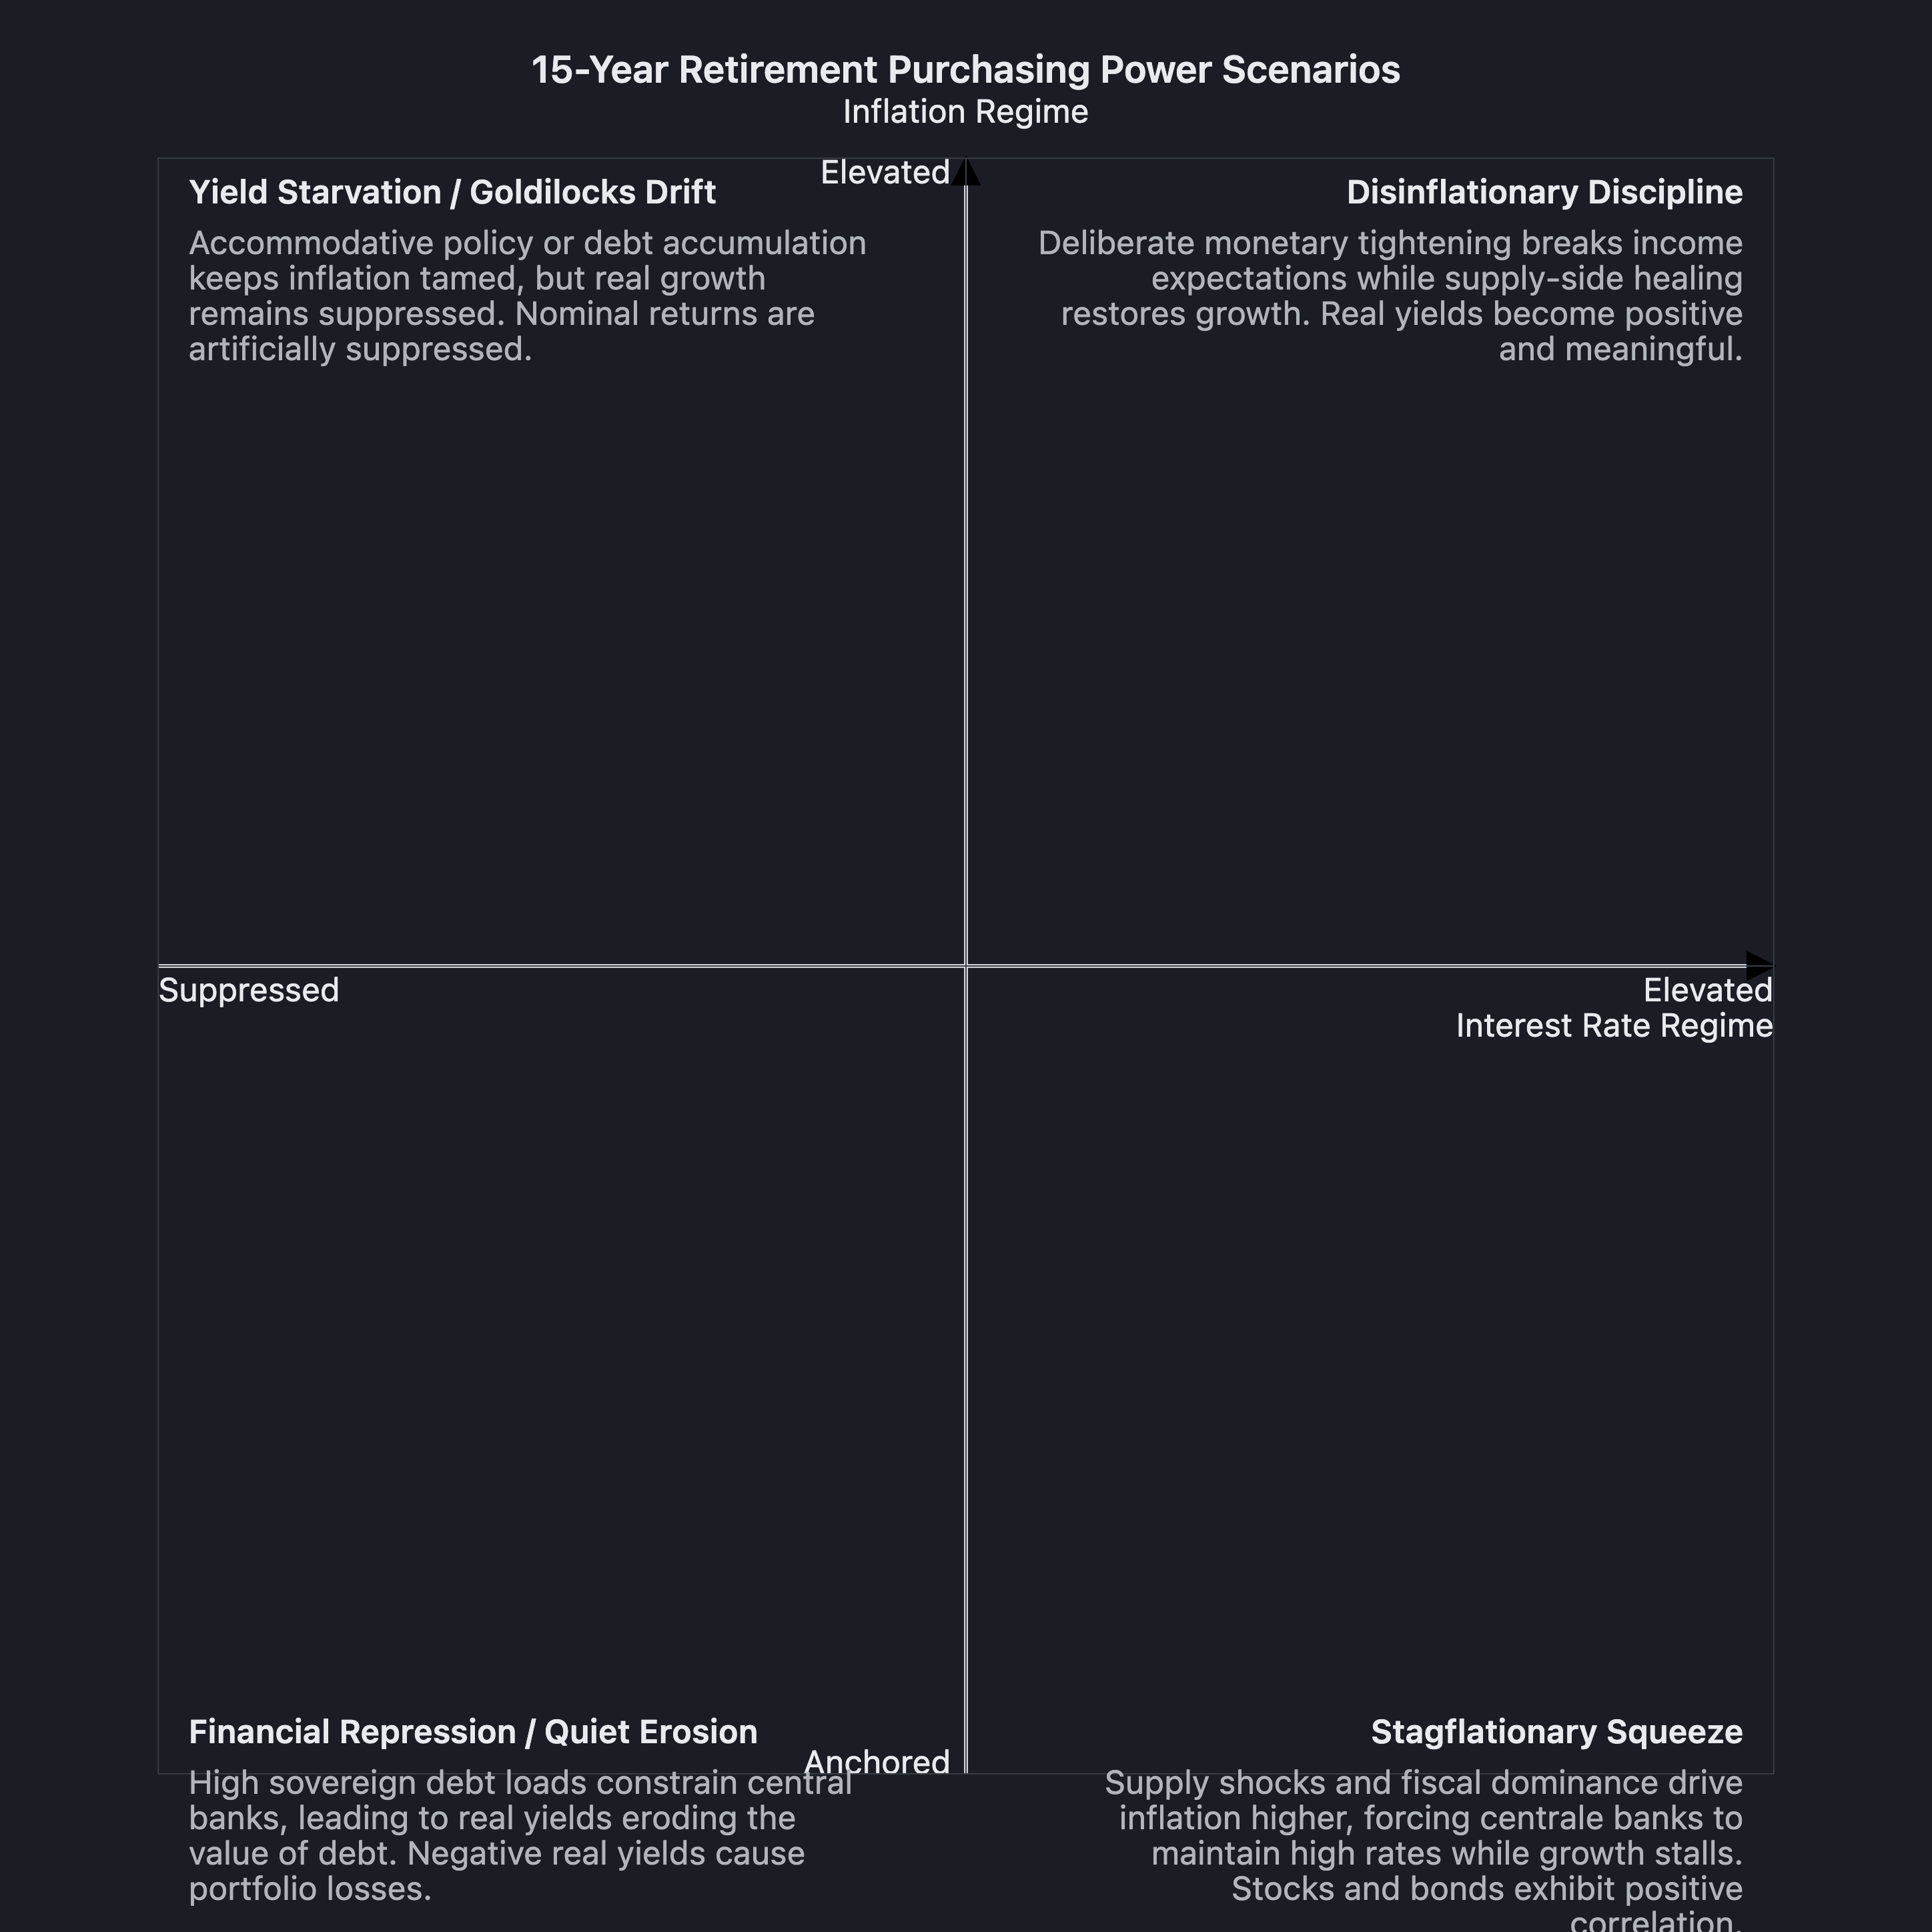
Axis 1: Interest Rate Regime. Low-label: Suppressed (relative to 15-year neutral). High-label: Elevated (relative to 15-year neutral). Drivers represented: central-bank reaction functions, term-premium dynamics, and real growth expectations.
Axis 2: Inflation Regime. Low-label: Anchored (relative to central-bank targets). High-label: Elevated (relative to central-bank targets). Drivers represented: realized outcome of wage dynamics, commodity cycles, and fiscal-monetary interactions.
Independence rationale: Rates and inflation are driven by orthogonal primary causal levers, preventing the matrix from collapsing into a diagonal 1×4 line. Rates are largely the price of duration set by central-bank policy and term-premium demands. Inflation is the outcome of supply shocks, wage-price spirals, and fiscal constraints. A central bank can lower policy rates into negative real territory while inflation rages, or hold rates restrictive while supply heals and inflation normalizes. Historical precedent exists for all four quadrants (e.g., 1981–1983 Volcker disinflation, 1970s stagflation, 2010s low-rate/low-inflation equilibrium, 2021–22 low-rate/high-inflation fiscal expansion), proving they do not strictly covary over a 15-year horizon.
Scenario matrix (2×2)
[Quadrant TL] — Yield Starvation / Goldilocks Drift: Suppressed Rates / Anchored Inflation.
Narrative: Accommodative policy or debt accumulation combined with low aggregate demand keeps inflation tamed, but real growth remains suppressed or the system becomes a fragile equilibrium dependent on asset prices. Nominal returns are artificially suppressed by central-bank accommodation, or equity multiples are supported by low discount rates but remain highly vulnerable to asymmetric reversal.
Strategic translation: An initial withdrawal rate ≤ 3.0% is required to survive the 15-year real-return drag without premature depletion.
[Quadrant TR] — Disinflationary Discipline: Elevated Rates / Anchored Inflation.
Narrative: Deliberate monetary tightening successfully breaks embedded inflation expectations while supply-side healing restores normal growth, making real yields positive and meaningful. Nominal discount rates compress equity multiples, but genuine bond coupons provide a reliable buffer for withdrawal sequences.
Strategic translation: A withdrawal rate ≤ 3.5% is sustainable given the genuine bond coupon buffer, provided strict adherence to cut-rules if early recessionary sequence risk materializes.
[Quadrant BL] — Financial Repression / Quiet Erosion: Suppressed Rates / Elevated Inflation.
Narrative: High sovereign debt loads and political pressure constrain central banks from hiking rates, leading to explicit or implicit caps on nominal yields below the inflation rate to erode the real value of debt. Deeply negative real yields cause traditional 60/40 portfolios to suffer real-purchasing-power losses on both duration and coupons (the “silent thief”).
Strategic translation: A withdrawal rate ≤ 2.5% is necessary to preserve real capital, unless the portfolio is already heavily weighted to non-correlated real assets.
[Quadrant BR] — Stagflationary Squeeze: Elevated Rates / Elevated Inflation.
Narrative: A feedback loop emerges where persistent supply shocks and fiscal dominance drive inflation higher, forcing central banks to maintain aggressively high rates while growth stalls. Stocks and bonds exhibit positive correlation in losses simultaneously; cash becomes a temporary, albeit eroding, haven. Traditional diversification fails.
Strategic translation: Highly dynamic; mandatory application of a 10% withdrawal cut if the portfolio drops 20% from its high-water mark to avoid catastrophic sequence-of-returns failure.
Leading indicators per scenario
Yield Starvation / Goldilocks Drift — Leading indicators: 10-year real yield sustained < 0.5% / persistent flattening of the yield curve despite stable inflation data / term premium near zero or negative. Where to look: Fixed income markets, central bank yield curves, and term premium tracking. Threshold for declaring this scenario unfolding: Sustained observation of these conditions across multiple consecutive quarters.
Disinflationary Discipline — Leading indicators: 10-year real yield sustained > 2% / central bank policy rate above neutral for 12+ months / positive, rising term premium. Where to look: Federal funds rate projections, 10-year TIPS real yields, and macroeconomic growth data. Threshold for declaring this scenario unfolding: Rates remain elevated while macroeconomic data confirms inflation is firmly anchored at target.
Financial Repression / Quiet Erosion — Leading indicators: 10-year nominal yield < 3% with 5y5y breakeven inflation > 3% / explicit or implicit caps on long-term yields while CPI prints > 4% / widening negative real yield on 10-year TIPS. Where to look: CPI prints, breakeven inflation rates, and TIPS markets. Threshold for declaring this scenario unfolding: CPI consistently runs above 4% while nominal yields are artificially suppressed below 3%.
Stagflationary Squeeze — Leading indicators: 5y5y breakeven inflation > 3.5% / simultaneous spikes in commodity prices and wage growth (> 5%) coupled with declining manufacturing PMIs / central banks hiking rates into a contracting economy. Where to look: Wage growth reports, manufacturing PMI data, and commodity indexes alongside central bank meeting minutes. Threshold for declaring this scenario unfolding: Policy rates rise concurrently with contracting economic growth and persistently high inflation metrics.
Strategic implications
Robust strategies (work across all four scenarios):
- Implement a dynamic withdrawal guardrail system (e.g., Guyton-Klinger: reduce withdrawals by 10% if the portfolio drops 20% from its high-water mark).
- Maintain a dedicated cash/treasury bill buffer sized to 1–3 years of withdrawal needs to prevent forced asset sales during drawdowns and meet RMD obligations without distress.
- Construct a liability-matching bond ladder (nominal and inflation-protected) sized to the gap between guaranteed income and target real spending.
- Minimize fixed-fee drag and prioritize tax-efficient asset location, as fee compounding is destructive in low-return or high-inflation environments.
Scenario-dependent strategies (require correctly identifying which scenario):
- Duration Management (Q3/Q4 dependent): Actively shorten fixed-income duration by 1–2 buckets if Q3/Q4 indicators trigger and sustain for two consecutive quarters. Lengthen duration only if Q1/Q2 is confirmed.
- Equity Factor Tilting (Q3/Q4 dependent): Shift equity factor exposure by 5–10% from growth to value/quality (strong balance sheets, pricing power) if Q3/Q4 inflationary indicators persist for one quarter.
- Decumulation Optionality (Q1/Q3 vs Q3/Q4 dependent): Defer inflation-protected annuity purchases in low-rate regimes (Q1/Q3), as they become expensive; conversely, front-load TIPS ladders when high-inflation regimes (Q3/Q4) lock in.
Contingent actions (tied to specific leading indicators):
- IF 10-year TIPS real yields fall below -1.5% for three consecutive quarters (Q3 indicator), THEN execute tactical shift: reduce nominal bond allocation by 15% and redeploy into global infrastructure, TIPS, and broad commodities.
- IF 5y5y breakeven crosses 3.5% and policy is visibly behind the curve, THEN activate the inflation-hedge sleeve, reduce nominal bond duration, and reset the bond ladder’s real component upward.
- IF term premium turns negative and credit spreads compress to cycle tights, THEN reduce credit risk and take equity risk off the table, as Goldilocks reversal risk is asymmetric.
Wild card
Wild card: The Longevity-AI Convergence. A medical-AI breakthrough extends healthy lifespan by 15–25 years. This renders the 15-year decumulation planning horizon radically insufficient. The rate/inflation matrix becomes secondary to the denominator (years the portfolio must sustain).
Why it sits outside the matrix: This is an exogenous shock to the fundamental planning assumption. No combination of interest rates and inflation addresses a structural doubling of retirement duration.
Indicator that it may be unfolding: Rapid, mainstream regulatory approvals for radical longevity-altering therapies; systemic repricing of late-stage life annuities and healthcare costs well beyond current actuarial tables.
Wild card: Sovereign Debt Restructuring / CBDC Paradigm Shift. A major developed economy faces sudden loss of confidence in sovereign debt, triggering emergency restructuring or rapid implementation of a Central Bank Digital Currency with programmable, negative-yield penalties.
Why it sits outside the matrix: It fundamentally destroys traditional asset pricing and the concept of a stable risk-free rate, invalidating the axes entirely.
Indicator that it may be unfolding: 10-year sovereign CDS spreads rising above the historical 90th percentile for two consecutive quarters; central bank consultation papers proposing retail CBDCs with negative-yield features; sustained drop in foreign-customer share of sovereign debt auctions.
Confidence in Assumptions and Findings
- Axis Selection & Independence: High confidence. The orthogonal causal-lever argument is supported by post-1970 developed-market macro regime empirical precedents (all four quadrants historically observed).
- Predetermined vs. Critical Uncertainty Classifications: High confidence. Demographic aging and technological friction reduction are unidirectional locks; their inflationary/deflationary offsets remain the genuine uncertainty.
- Leading Indicators: Moderate-to-high confidence. Utilizes standard, highly watchable macroeconomic thresholds (e.g., 5y5y breakeven, 10-year TIPS real yields, term premium) validated against historical regime transitions.
(visual rendered — see artifact)
Focal question
Over the next 15 years (2026–2041), how should a generic retirement portfolio be constructed and dynamically managed given uncertainty about the joint behavior of investment rates and inflation? The 15-year horizon spans at least one full economic cycle, multiple monetary-policy regimes, and a meaningful portion of retirement drawdown. The portfolio is treated generically here—no specific asset allocation, withdrawal rate, tax status, or geographic domicile is supplied; the matrix serves as a decision scaffold. A 60% global equities / 40% high-quality bonds baseline is used merely as a grounding reference for illustrative rebalancing actions, not as a universal recommendation.
Driving forces classified
Predetermined elements (will happen regardless of axis position):
- Demographic / population aging (Social): workforce ages, retiree-to-worker ratio rises, longevity increasing; locked through 2041.
- Healthcare cost inflation persistence (Social/Economic): direction is structural, though magnitude is uncertain.
- Climate / energy transition costs (Environmental): capital reallocation away from carbon-intensive assets is directionally locked by policy and physical realities; magnitude is the variable.
- Sovereign debt levels (US, EU, JP) (Political/Economic): stock exists; servicing path is uncertain.
- Geopolitical fragmentation (Political): direction is set; severity is the variable.
Critical uncertainties (could go either way):
-
Inflation regime (Economic): re-anchor at ~2% vs. revert to a 1970s-style >3–4% path.
-
Investment return / rate regime (Economic): r* genuinely unknown; normalize to historical (~4.5–5.5% nominal) vs. “Japanification” (real yields near zero).
-
AI / productivity shift (Technological): productivity boom vs. displacement shock.
-
Stock–bond correlation (Economic): positive since “Discipline Returns”: Causal logic where central banks anchor inflation expectations; sustained restrictive policy breaks recent inflation psychology, allowing the “last mile” of disinflation to succeed via real growth. Narrative: AI/automation breakthroughs raise productivity, suppressing unit labor costs while driving corporate earnings and capital appreciation; debt is outgrown by nominal GDP. Alternatively, central banks anchor inflation expectations and sustained restrictive policy breaks recent inflation psychology. Positive real rates restore the term premium; bonds deliver genuine income; equity valuations compress to historical norms; cash/short-duration earn positive real returns; stock-bond correlation returns to negative-to-zero (1990s–2000s norm), restoring 60/40 diversification. Strategic translation: A classic 60/40 portfolio is rehabilitated. Conservative withdrawals are sustainable, and growth-oriented equity thrives on real-return drivers. Fixed immediate annuities can be purchased at fair value, as higher long-duration nominal yields let insurers offer improved real-payout ratios. The primary risk is complacency and over-concentration in momentum tech. Withdrawal posture should maintain or modestly grow real spending, funded by equity gains.
-
Top-Right — Nominal Surge / Stagflation Lite: High investment rates / High inflation. Narrative: Persistent fiscal deficits and deglobalization keep inflation elevated. Corporations pass costs through, holding margins, so asset prices inflate nominally and nominal returns are high, but real returns are merely average. Alternatively, persistent supply-side shocks (geopolitical, energy, labor) keep inflation sticky while central banks hold restrictive; growth is real-rate-burdened but positive, and real returns on nominal bonds are negative or marginal. Stock-bond correlation turns non-negative or positive, meaning bonds no longer hedge equity drawdowns when inflation is the dominant shock. The portfolio behaves like a single risk-on nominal-growth bet. Strategic translation: Explicit inflation hedges (TIPS, real assets, energy, commodities) and short fixed-income duration are required to avoid capital losses as central banks hike. Traditional 60/40 fails on both legs—the “40” is a real-return drag and the diversification benefit collapses via non-negative correlation. Cash is a slow bleed; equity selection emphasizes real-asset-linked sectors, away from long-duration growth. Withdrawal posture should maintain nominal spending, apply COLA annually, and keep withdrawal rates flexible because nominal returns look fine while real purchasing power is fragile.
-
Bottom-Left — Secular Stagnation / Japanification: Low investment rates / Low inflation. Narrative: Aging demographics and high sovereign debt suppress aggregate demand. Deflationary pressures dominate; central banks keep rates low or cut to zero with limited real-economy effect. Anemic growth leads to muted equity returns and prolonged Japanification of Western markets. Causally distinct from the productivity boom: here rates are low because of (or despite) economic weakness, whereas in the productivity boom, rates are high because policy succeeded. The yield curve is pinned low; deposit rates are near zero; equity valuations are elevated by forced risk-taking; bonds deliver capital gains but little income; stock-bond correlation is loosely negative, but the bond-leg income is too small to fund withdrawals. Strategic translation: Capital preservation is paramount. Dividend equities, quality compounders, and growth assets dominate. High-quality short-duration bonds and dividend aristocrats are favored, alongside long-duration bonds for preservation, not income. Annuity payouts compress because insurers cannot earn an adequate spread in a low-rate environment. The standard 4% rule is actually too conservative given the low nominal growth. Withdrawal posture requires conservative real spending and deferring guaranteed income (e.g., Social Security) to maximize the payout multiplier.
-
Bottom-Right — Stagflation Squeeze / Financial Repression: Low investment rates / High inflation. Narrative: Supply shocks (geopolitical conflict, resource scarcity) and slowing growth trap central banks—hiking crashes the economy/equities, while cutting unleashes hyperinflation. Alternatively, central banks tolerate or are forced to accommodate above-target inflation to keep debt service manageable; fiscal dominance becomes the regime, and inflation acts as the de facto default mechanism. Causally distinct from stagflation lite: in the latter, central banks are fighting inflation; here, they are enabling it. Cash and nominal bonds are the losing positions; real fixed-income returns are deeply negative. Stock-bond correlation is positive and sustained, so both legs lose real purchasing power in a correlated fashion. The 60/40 portfolio fails not from bond volatility, but from correlated inflation loss. Strategic translation: A defensive posture is required. Pivot to cash equivalents, short-term TIPS, gold, and managed futures (trend-following) that can profit from volatility or declining markets. Note that cash-heavy allocations still erode in real terms. Equity concentration works only with strict discipline; index-hugging 60/40 fails, and the “yield trap” is the dominant failure mode. Withdrawal posture requires cutting real spending by 5–10%, suspending discretionary withdrawals, and relying on the predetermined cash buffer.
Leading indicators per scenario
Productivity Boom / Discipline Returns — Leading indicators: sustained core-PCE decline / rising enterprise tech capex / flat or declining long-term Treasury yields despite positive GDP / TIPS spreads widening while breakevens hold or fall / unemployment rising gradually without recession / 10-yr real yields persistently >1.5% / 5y5y breakeven anchored near 2% / rolling 12-mo stock-bond correlation turning negative after a multi-year positive run. Where to look: monthly BEA reports, quarterly earnings, daily/monthly Treasury data, BLS unemployment data. Threshold for declaring this scenario unfolding: 10-yr real yields persistently >1.5% combined with a rolling 12-mo stock-bond correlation turning negative.
Nominal Surge / Stagflation Lite — Leading indicators: commodity indices breaking multi-year resistance / Employment Cost Index (ECI) sustaining >5% annual growth (Q1 2026 ECI YoY ~3.40% vs. long-term average 2.98%, making >5% a severe wage-price-spiral threshold) / core CPI persistently >3% / wage growth >4% with low unemployment / steepening yield curve as breakevens rise / 10-yr breakevens rising while nominal yields rise less (TIPS spreads narrow/invert) / rolling 12-mo stock-bond correlation turning positive after a multi-year negative run. Where to look: daily/monthly commodity markets, quarterly BLS ECI and CPI reports. Threshold for declaring this scenario unfolding: ECI sustaining >5% annual growth alongside core CPI persistently >3% and a positive rolling 12-mo stock-bond correlation.
Secular Stagnation / Japanification — Leading indicators: persistent yield-curve inversion / declining M2 velocity and falling breakeven inflation / consistent forward-earnings-guidance misses / 10-yr nominal yield <2% / 5y5y breakeven <1.5% / recession or near-recession conditions / CPI ex-shelter declining / CAPE persistently elevated. Where to look: daily/monthly yield curve data, monthly FRED M2 velocity, quarterly corporate earnings guidance, BLS CPI reports. Threshold for declaring this scenario unfolding: 10-yr nominal yield <2% coupled with 5y5y breakeven <1.5% and persistent yield-curve inversion.
Stagflation Squeeze / Financial Repression — Leading indicators: simultaneous rise in unemployment and CPI for 3+ consecutive quarters / negative real GDP growth / rapidly widening high-yield credit spreads alongside rising inflation expectations / real 10-yr yield < –1% (TIPS-adjusted) / breakevens unanchoring above 3% with nominal yields flat or falling / gold rally alongside rising breakevens / central-bank balance-sheet expansion resuming / fiscal deficit sustained >6% of GDP / rolling stock-bond correlation persistently positive. Where to look: monthly BLS unemployment/CPI, quarterly BEA GDP, daily credit spread monitors, central bank balance sheet reports. Threshold for declaring this scenario unfolding: Real 10-yr yield < –1% combined with breakevens unanchoring above 3% and a persistently positive rolling stock-bond correlation during negative real GDP growth.
Strategic implications
Robust strategies (work across all four scenarios):
- Implement a dynamic guardrail withdrawal rule (e.g., Guyton-Klinger) instead of a static 4%; spending adjusts to portfolio performance and sequence-of-returns risk, expressed as a variable withdrawal rate (~3–5% range) tied to performance and the inflation regime.
- Maintain a liquidity buffer of 24 months (1–3 years) in cash/short-duration instruments to eliminate sequence-of-returns risk and avoid forced selling.
- Ensure true diversification across non-correlated return drivers (real assets, international equities, cash/short-duration sleeve), not just traditional stocks and bonds.
- Maintain geographic diversification: Ex-US equity at 25–40% of the equity sleeve, currency unhedged for long-horizon investors; international bond sleeve capped at 10% on credit-quality grounds, reducing single-country sovereign, demographic, and currency risk.
- Enforce cost minimization: a 50 bps fee differential over 15 years equates to approximately 8% of terminal wealth ((1.005)^15 − 1 ≈ 8.08%).
- Apply tax-location discipline: optimize asset location (taxable / tax-deferred / tax-free) to the specific account structure.
Scenario-dependent strategies (require correctly identifying which scenario):
- Q1 (Productivity Boom): Overweight global equities and small-cap value, underweight long-duration bonds. Heavy nominal bonds and heavy cash work in this scenario only.
- Q2 (Nominal Surge) & Q4 (Stagflation Squeeze): Heavy allocation to TIPS and inflation-protected assets; heavy commodities and REITs.
- Q3 (Secular Stagnation): Overweight high-grade sovereign bonds; annuitize a portion to guarantee baseline income; minimize taxable capital-gains harvesting.
- Cross-cutting: Heavy dividend/growth equities are favored in Q3 and Q4 (in nominal terms), but they compress in Q1 and de-rate in Q2.
- Stock-bond correlation monitor: A 12-mo rolling correlation turning positive is itself a reallocation trigger—rotate toward real assets and TIPS regardless of which quadrant is read as unfolding; a return to negative correlation signals reallocation back toward 60/40 weights.
Contingent actions (tied to specific leading indicators):
- Core CPI >5% for three consecutive months → reallocate 10–15% from long-duration nominal bonds into Series I Savings Bonds, TIPS, or broad commodity ETFs.
- 10-yr Treasury yield drops below 3.0% (a significant deviation from the ~3.97% median forecast) while GDP is positive → extend bond duration to lock yields, increase dividend-growth equities.
- Breakeven 5y5y >3% → reduce nominal-bond duration; rotate into TIPS or short-duration nominals.
- 10-yr real (TIPS) yield >1.5% with breakevens anchored → extend nominal-bond duration.
- Real GDP contracts for two consecutive quarters with CPI >3% → shift to defensive equity (quality, dividend); reduce equity beta.
- Real 10-yr yield < –1% with breakevens unanchoring → rotate to real assets, gold, and foreign-currency exposures.
- Central-bank independence is challenged but the regime is still functioning → begin building the wild-card hedge incrementally.
Wild card
Wild card: Sovereign debt restructuring / capital controls or a fiscal dominance cascade. A major reserve-currency nation, unable to service debt or control inflation conventionally, imposes sudden non-market measures (direct wealth taxes on investment accounts, punitive taxation on retirement withdrawals, or capital controls restricting repatriation of offshore assets), or a loss of central-bank independence combined with a sovereign debt crisis triggers a step-change in inflation the matrix cannot bound (e.g., rapid reserve-currency devaluation of 15–30% in <18 months, or a hyperinflation episode >15% CPI for multiple years). Why it sits outside the matrix: The 2×2 assumes a functioning monetary regime with predictable central-bank reaction functions. These wild cards break that assumption entirely, meaning inflation and rates could both spike, both collapse, or move non-monotonically. Indicator that it may be unfolding: Central-bank legal-status changes, sovereign credit-rating moves on the reserve issuer, persistent fiscal monetization visible in central-bank balance-sheet composition, implementation of capital controls, foreign-currency reserve drawdowns by reserve issuers, or failed sovereign bond auctions by the reserve issuer.
Contingent hedge for matrix invalidation: If a major reserve issuer experiences a failed sovereign bond auction, formal abandonment of an inflation-targeting mandate, or rapid reserve-currency devaluation (>10% trade-weighted in <12 months, not attributable to rate differentials), move 10–20% toward gold, non-reserve-issuer sovereign debt, broad international equities tilted away from the affected jurisdiction, and (as insurance) select cryptocurrencies. Intensify geographic diversification and reduce nominal cash in the affected currency. A smaller-allocation variant (~5% in jurisdictionally diverse physical hard assets held outside the domestic banking system) is the minimum version. This differs from Q4 strategies, which assume the policy regime still functions, whereas the wild card assumes the regime itself is the problem.
Additional considerations
No quadrant in this framework is designated “most likely” or “baseline”; all four carry equal standing. Data anchors like the FOMC long-run midpoint (3.25%) and the ~3.97% 10-yr forecast are cited strictly as reference points consistent with the low-inflation/high-rate quadrant, explicitly not as a forecast or probability-weighted outcome.
This framework deliberately omits probability estimates, as scenario planning resists probability-weighting quadrants (probabilistic forecasting is a distinct analytical mode). Furthermore, it does not provide a specific portfolio recommendation, as actual allocation depends on age, account type, withdrawal rate, tax situation, and risk tolerance, none of which were supplied. The matrix does not predict time-to-resolution; it dictates what to do if a scenario dominates, leaving ongoing leading-indicator monitoring as the portfolio manager’s active task.
Historical and mathematical claim verifications anchor this analysis: the 1970s stagflation era produced negative real returns, while the 2010s featured low inflation and high nominal returns (the S&P 500 did not surpass its January 1970 real value until November 1986). The mathematical impact of fees is confirmed: a 50 bps fee differential over 15 years results in an ~8.08% reduction in terminal wealth.
Focal question
How should a retirement portfolio be positioned — and its withdrawal sustainability assessed — across a 2×2 of interest-rate environment × inflation over a 15-year horizon (2026–2041)? The horizon of 15 years is used here as the modeling window, but flag this as a live decision: whether 15 years is a planning horizon or a life-expectancy assumption matters, because a real retirement plan should assume 25–30+ years (see the longevity wild card). What follows is a framework with qualitative portfolio impacts, not live numbers. Return figures are deliberately not fabricated; conversion to calculation requires your inputs, which are listed at the end.
A note on scenario naming: the four quadrants are identified by quadrant position (real-rate sign × inflation level). Two parallel readings assigned conflicting numbering to the same four quadrants, so each scenario below carries both candidate names. The four quadrants themselves are agreed.
Driving forces classified
Predetermined elements (will happen regardless of axis position):
- Demographic aging / retiree decumulation (Social). Boomer decumulation is mechanically baked in; the retiree is 15 years deeper into drawdown at horizon end. Honest caveat: the market direction of aging is genuinely contested (disinflationary via weaker demand vs. inflationary via labor scarcity) — the demographic fact is predetermined, its effect is not.
- High starting sovereign debt/GDP (Economic/Political). The debt stock already exists and won’t unwind in 15 years; it constrains policy in every scenario and is the precondition for the suppression (negative-real) row.
- Front-loaded sequence-of-returns risk (Economic). For a retiree the first ~10 years dominate outcomes regardless of scenario — a structural fact of decumulation, not a forecast.
- Existence of inflation-linked instruments (TIPS, I-bonds) (Economic). Available tools in all futures.
- Index/passive dominance of market structure (Economic).
Critical uncertainties (could genuinely go either way):
- Inflation regime (Economic) — moderate vs. elevated. = Axis 1.
- Real-rate / monetary-policy posture (Economic/Political) — positive vs. negative real. = Axis 2.
- Productivity growth (AI/energy) (Technological). Dual-listed deliberately: the moderate variant lives inside the matrix, feeding the real-growth assumptions of the two moderate-inflation quadrants; the extreme variant is large enough to scramble all four quadrants and is treated as a wild card.
- Central-bank independence (Political) — the pivot for Axis 2; politically contestable, explicitly not predetermined.
- Fiscal-political appetite for deficits / debt monetization (Political).
- Geopolitical fragmentation / supply-chain & energy stability (Environmental/Political) — a wild-card source.
Certainty-masquerade flag: “Rates stay structurally higher than the 2010s” and “the Fed stays independent and inflation reverts to 2%” are refused as predetermined baselines — each is a live uncertainty being marketed as settled, and pinning it would be the certainty-masquerade trap. (Axis 2 is that uncertainty.)
Critical uncertainties as axes
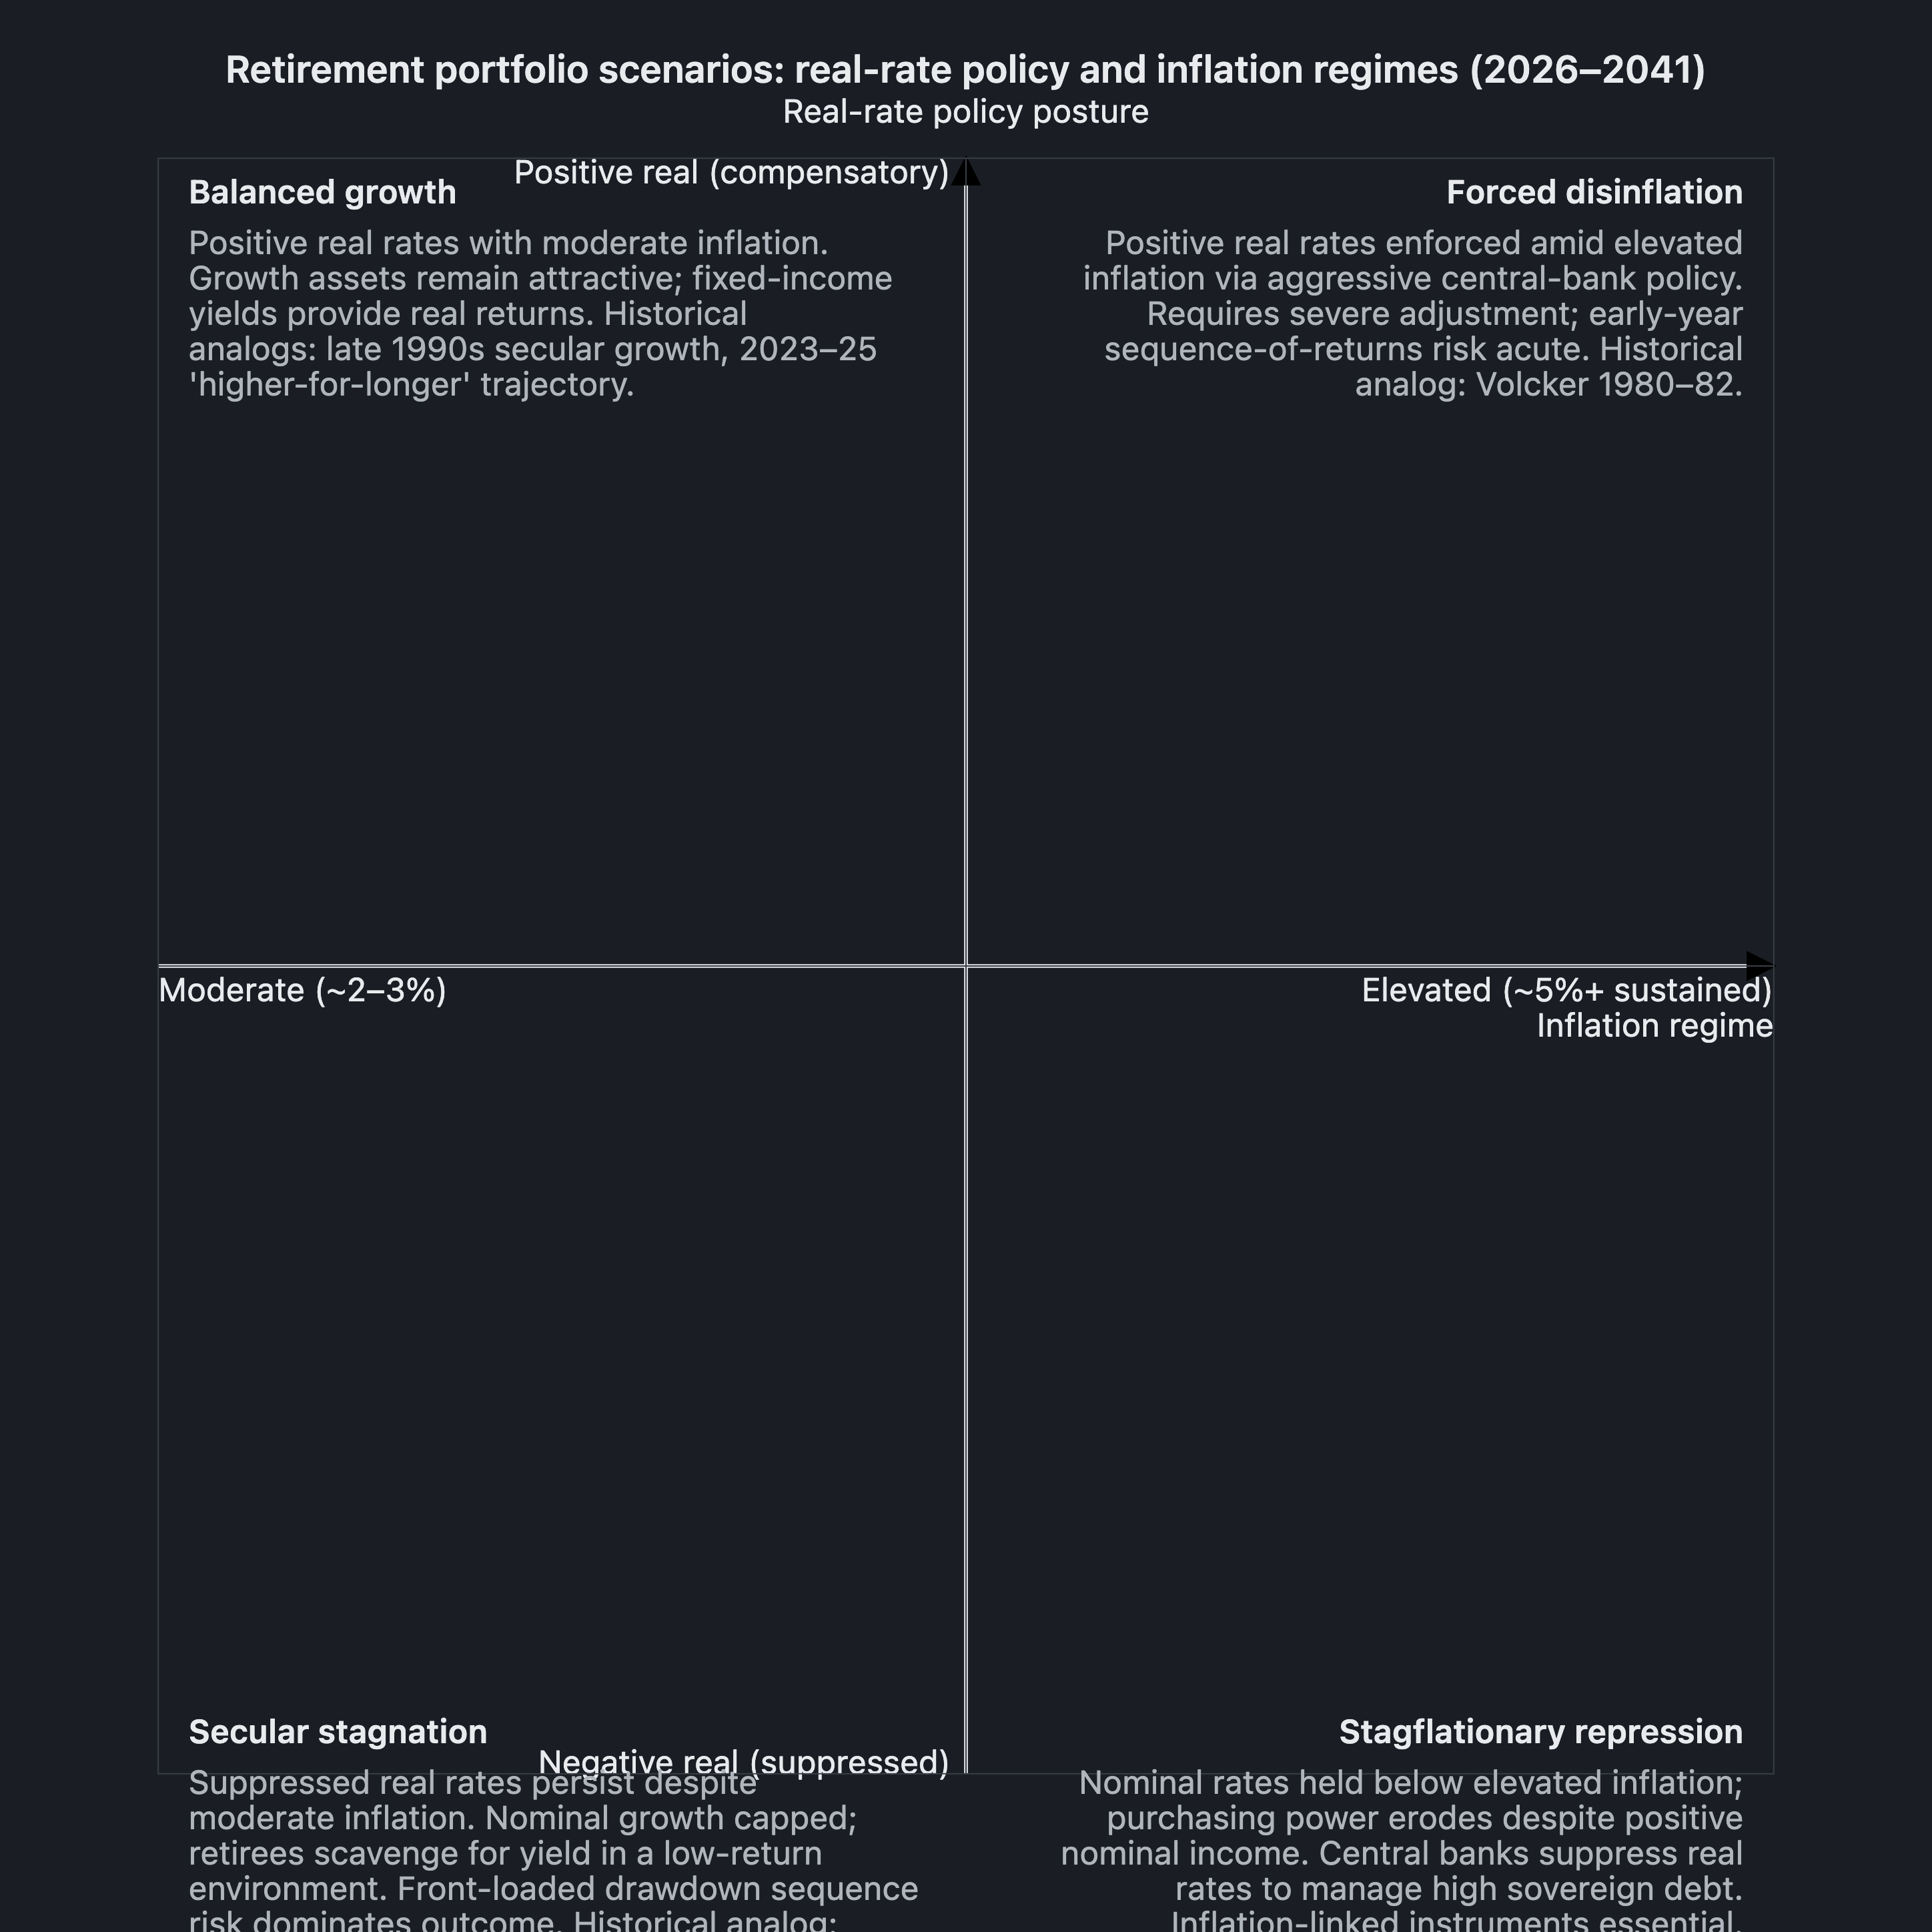
Axis X — Inflation regime. Low-label: moderate (~2–3%). High-label: elevated (~5%+ sustained). Drivers represented: supply/demand, wage dynamics, expectations.
Axis Y — Real-rate posture / policy real-rate stance. Low-label: negative real (rates trail inflation / policy suppresses nominal rates below inflation — financial repression). High-label: positive real (rates compensate / policy allows nominal rates to meet or exceed inflation). Defined as the discrete policy choice (allow vs. suppress) rather than the realized real-rate number — this framing forecloses the arithmetic objection that real ≡ nominal − inflation would merely re-import Axis X, because the same inflation print has historically been met with either stance.
Independence rationale: Inflation level is set by supply/demand/wage/expectations dynamics; the real-rate posture is set by separate forces — central-bank credibility/independence, fiscal dominance, the debt burden, whether inflation is supply- or demand-driven, and political tolerance for the recession needed to enforce positive real rates against a high debt load. The same inflation level was met with suppression (1940s peg) and with aggressive positive-real hikes (Volcker; 2023–25), proving historical decorrelation. All four quadrants have real historical analogs: low rates + moderate inflation → 2010s (secular stagnation); high rates + elevated inflation → Volcker 1980–82; low rates + elevated inflation → 1940s US Treasury peg (negative real), the 1973–79 behind-the-curve Fed, arguably 2021–22; high rates + moderate inflation → late-1990s and the 2023–24/25 “higher-for-longer” endpoint. The empirical point that all four cells have real historical analogs is verified against approved sources.
Alternative axes considered: One stream read the real-rate reframe as a rescue — the raw-nominal axis “collapses toward a diagonal” (a central bank raises rates because inflation rises), so reframing to real-rate posture rescues the off-diagonal cells from near-emptiness. The other stream read it as a sharpening that guarantees orthogonality, not a rescue: under scenario planning’s equal-standing rule, probability-clustering on a diagonal is not itself a correlated-axes failure — the only test is whether off-diagonal cells can be coherently populated, and they can (all four nominal cells have analogs), so the reframe sharpens rather than saves. The deliverable uses the real-rate posture framing under both readings because it holds the four-quadrant structure most cleanly; the disagreement is only about whether the nominal matrix would have been a correlated-axes trap or merely a probability-skewed-but-valid one.
User fork (carried, not resolved): If you genuinely meant the raw nominal level (e.g. “will my bond ladder yield 2% or 6%”), the matrix is re-cut on that reading on request; real-rate posture is the default because it holds the four-quadrant structure most cleanly.
Threshold note (modeling choices, recalibratable): moderate inflation ≈ 2–3%, elevated ≈ 5%+ sustained; the real-rate axis turns on the sign of policy-rate-minus-trailing-inflation, not its magnitude (the suppression quadrants need real rates merely negative, not deeply so). You may move the partitions (e.g. set a 4% alarm line).
Scenario matrix (2×2)
Quadrant TL — Reset to Normal / Real-Rate Reset: Positive real / Moderate inflation. Narrative: A higher neutral rate holds (deficit-driven bond supply, reshoring capex, normalized term premia, decent productivity) while inflation re-anchors near target. Money is tight in real terms because real growth supports it, not because the central bank is panicking. “Higher for longer” as a durable state. Analogs: late-1990s, the 2023–25 endpoint. Equity valuations compress (higher discount rate) but earnings hold. Strategic translation: The friendliest/most benign quadrant for a retiree drawing income. Bonds throw off positive real yield — fund withdrawals from coupons without selling equities into weakness; the 60/40 is rehabilitated; liability-match essential spending to positive real yields via TIPS/Treasury ladders. The Morningstar framing applies: “safer, higher yields” with fixed income’s much lower volatility than equities. Withdrawal adequacy is the strongest of the four — arguably the highest sustainable withdrawal; income-oriented retirees do best. The sustainability danger is the journey, not the destination — the transition into this world repriced bonds brutally (2022).
Quadrant TR — The Long Burn / Stagflation Fight (Volcker Redux): Positive real / Elevated inflation. Narrative: Supply shocks (energy, geopolitics, deglobalization) plus a wage-price spiral push inflation high; the central bank stays orthodox and forces the policy rate above inflation (positive real), but inflation stays elevated because the supply/wage drivers persist. This is the Volcker-1980–82 configuration — tight in real terms and still inflationary — explicitly distinct from the earlier behind-the-curve 1970s (which belongs in Quadrant BR). Historical anchor narrowed to Volcker 1980–82; US CPI peaked ~14.6% YoY in early 1980 (annual-average ~13.5%). Transition flag: real rates are negative early (inflation outruns the first hikes) and turn positive late as the medicine bites — the quadrant earns its positive-real placement at the horizon’s destination, not its start. Strategic translation: The nastiest near-term for a 60/40 — stocks and nominal bonds fall together (2022 pattern, sustained/extended); diversification fails exactly when needed; an earnings recession stacks on multiple compression. Survival kit: real assets, short-duration TIPS, I-bonds, energy/value/pricing-power equities, reduced equity duration. Withdrawal adequacy is the acute threat: this regime family historically drove the “safe” withdrawal rate down toward ~4% — the 1966 retiree cohort, whose 30-year horizon ran straight into the 1966–1982 stagflation, is Bengen’s documented worst case. A rigid inflation-adjusted 4% is at real risk of depletion, especially if it hits in the first five years. Sequence-of-returns risk at its worst; deep early drawdown plus rising withdrawals is the classic ruin path.
Quadrant BL — Sleepy Plateau / Easy-Money Soft Landing: Negative real / Moderate inflation. Narrative (two readings): Inflation stays tame, the central bank keeps rates low, real rates hover near/below zero. Analogs: 2010s / 2013–2019. One reading is Japanification / pessimistic: weak demand, aging, a savings glut, low real growth; equities did well in the rear-view (low discount rate, TINA) but the trap is low future expected returns from a rich starting point; withdrawal is nominal-fine but starting yields are too low to fund income, forcing sales of appreciated equities; failure mode is death by low returns and a long grind that underfunds a 30-year retirement. The other reading is a benign soft landing: inflation reverts to target, growth holds, ZIRP keeps real rates slightly negative; equities are supported (but valuations rich/vulnerable), bonds return little; a 4%-type draw is comfortable nominally with mild real erosion and good sustainability — the caveat being that the engine is equities, so sequence risk in the first ~5 years is the live threat. Shared across both readings: negative/near-zero real rates, moderate inflation, equities as the return engine, the reinvestment/low-yield problem for bonds, and first-5-years sequence exposure. Strategic translation: Withdrawal verdict diverges with the reading — nominal-comfortable under both, but “death by low returns” under the Japanification reading versus “good sustainability with mild real erosion” under the soft-landing reading. Either way the return engine is equities, so the live threat is first-5-years sequence risk, and the structural problem for the bond sleeve is reinvestment at low yields.
Quadrant BR — The Quiet Squeeze / Financial Repression: Negative real / Elevated inflation. Narrative: Inflation runs hot, but the debt burden is too large to let the central bank raise rates enough to catch it — so policy deliberately keeps real rates negative to inflate the debt away; central-bank independence yields to fiscal need. The 1940s peg playbook (T-bill peg at 3/8% from 1942, long rates capped at 2.5% until the 1951 Treasury–Fed Accord, link not fully severed until 1953, while 1940s inflation spiked into the teens); operationally also the 1973–79 behind-the-curve Fed. Strategic translation: The worst quadrant for the conservative retiree / classic retiree killer for bonds and cash — guaranteed negative real returns; nominal balances look stable while purchasing power bleeds every year. A nominal-bond-heavy 60/40 is the wrong portfolio. Escape: real assets — TIPS, I-bonds, real estate, commodities, gold, equities with pricing power. Withdrawal adequacy is threatened by purchasing-power erosion, not nominal depletion: a real 4% quietly breaks — the portfolio statement lies; real spending power shrinks faster than the spreadsheet shows; sequence risk is hidden because it’s denominated in eroding currency. The sustainability risk is insidious — looks survivable on paper, fails in groceries.
Structural distinctiveness across the four: These are four distinct causal stories (anchored vs. panicking central bank; supply-shock-fight vs. deliberate-suppression under the same elevated inflation; Japanified-grind vs. soft-landing under the same moderate inflation), not magnitude variants. The positive-vs-negative-real split between TR and BR under shared elevated inflation — and between TL and BL under shared moderate inflation — is a causal fork (central bank in front of vs. behind the curve), not a severity dial.
Time-slice note: Quadrants TL, BL, and BR are treated as the dominant regime over the horizon; Quadrant TR is explicitly a transition-to-terminal path (negative real early → positive real late).
Leading indicators per scenario
The shared discriminating signal across the matrix is the policy-rate-minus-trailing-inflation gap: positive → top (positive-real) row; negative → bottom (negative-real) row. Breakeven/yield-level signals mostly track the inflation (Axis X) split.
Reset to Normal (TL) — Leading indicators: breakevens anchored ~2–2.5% / term premium rebuilding / bond-equity correlation turning negative again (bonds resume hedging) / core CPI stable ~2–3% with no recession. Where to look: TIPS breakevens, the term-premium estimate, rolling stock-bond correlation, core CPI. Threshold for declaring this scenario unfolding: the 10-yr real (TIPS) yield settling durably positive / holding above ~1.5% even as CPI falls, with the policy rate sitting above trailing inflation — this is the discriminator versus BL.
The Long Burn (TR) — Leading indicators: breakevens above ~3.5–4% and staying / wage growth outrunning productivity for several quarters / commodity-energy supply shocks / CPI re-accelerating despite hikes / rising unemployment / correlated equity-and-bond drawdowns / long-end and real yields rising fast off a negative base. Where to look: breakevens, wage-vs-productivity prints, commodity/energy spot and futures, the unemployment rate, stock-bond correlation, the long end. Threshold for declaring this scenario unfolding: the policy rate held above trailing inflation (positive real) even as inflation stays elevated — the central bank in front of, not behind, the curve; this is the discriminator versus BR.
Sleepy Plateau (BL) — Leading indicators: 10-yr nominal yields drifting back toward 2–3% / breakevens below target / a flat or inverted curve persisting without recession / falling productivity prints / core CPI ~2% with the policy rate falling / term premium compressed / stable employment / high equity multiples. Where to look: the 10-yr nominal, breakevens, the curve shape, productivity prints, core CPI, equity multiples. Threshold for declaring this scenario unfolding: the policy rate sitting at/below trailing inflation (zero/negative real), with the 10-yr real yield drifting toward/below zero as CPI stabilizes — the discriminator versus TL.
The Quiet Squeeze (BR) — Leading indicators: inflation persistently above the policy rate / yield-curve control or large central-bank balance-sheet holdings / financial-repression signals (regulatory pressure on funds and banks to hold government bonds) / rising debt/GDP with suppressed long yields. Where to look: the policy-rate-minus-CPI gap, central-bank balance-sheet size and any YCC announcements, regulatory holdings mandates, debt/GDP against long-yield levels. Threshold for declaring this scenario unfolding: the policy rate held persistently below trailing inflation for 12+ months (sustained negative real) — the central bank choosing not to catch inflation; the discriminator versus TR.
Strategic implications
Robust strategies (work across all four scenarios — each carries a cost; “robust” means survives, not free):
- Cash-flow / liquidity bucket: 2–3 years’ spending in cash/near-cash, refilled by a 2–3-year bond ladder, so equities are never sold into a drawdown — directly attacks the predetermined front-loaded sequence risk; the practitioner bucket strategy. Cost: in TL and BL the cash sleeve is a guaranteed return drag versus staying invested — drag paid as insurance against TR’s sequence risk.
- Hold explicit inflation protection (TIPS / I-bonds); liability-match essential spending to a real-yield ladder. Two of four quadrants are elevated-inflation; a portfolio with zero real-rate assets is unhedged against half the matrix. Dominant in TR/BR, harmless in TL/BL. Cost: a permanent TIPS allocation underperforms nominal bonds in the disinflation quadrants (TL/BL) — yield given up there to be covered in TR/BR.
- Adopt a dynamic / guardrail withdrawal rule instead of rigid inflation-adjusted 4% — the single highest-leverage change; keeps every quadrant survivable. Cost: trades portfolio risk for lifestyle risk — spending becomes variable with real cuts in bad years; a genuine cost, but more survivable than depletion.
- Treat any pension / annuity / Social Security as the bond-like, inflation-hedged floor; size the risk portfolio against residual spending need (NPV-as-bond: subtract guaranteed income, fund the gap). Cost: concentrates sponsor/insurer credit risk and, if not inflation-adjusted, leaves the floor itself exposed to TR/BR erosion — the floor needs its own inflation stress-test.
- Keep meaningful equity exposure — do not de-risk to all bonds. Three of four quadrants punish a bond-heavy book differently; longevity demands real growth.
Scenario-dependent strategies (require correctly identifying which scenario — dangerous if guessed wrong):
- Bond duration: long duration is a gift in low-stable-rate worlds (TL, BL, and the early-pinned onset of BR) and toxic when rates rise (TR); in TL it is unnecessary (lock real yield via the ladder instead). Don’t lock long unless inflation is anchored.
- Nominal vs. real bonds: nominal fine in the moderate-inflation quadrants (TL/BL); want real (TIPS/I-bonds) tilted in the elevated-inflation quadrants (TR/BR).
- Equity weight & style: growth/long-duration equity favored in BL; value/energy/pricing-power favored in TR/BR.
- Real-asset / commodity tilt: pays in TR/BR, drags in TL/BL.
- Rising-equity glide path: benign if early returns are good (TL/BL); catastrophic if Quadrant TR arrives early.
Contingent actions (tied to specific leading indicators — pre-commit to a trigger now, act when the signal fires):
- IF 10-yr breakeven inflation closes above ~3.5% for two consecutive quarters → shift a defined slice of nominal bonds into TIPS/short-duration (preparing for TR/BR).
- IF positive real 10-yr yields settle durably above ~1.5% with anchored breakevens as CPI falls (TL confirming) → extend the TIPS ladder / bond duration and lock real yield — the best, cheapest time to lock real yield.
- IF the policy rate sits below trailing inflation for 12+ months / real yields stay negative while debt/GDP keeps climbing (BR forming) → rotate the bond sleeve toward TIPS/I-bonds/short duration, tilt toward real assets and away from cash drag — the Axis-Y discriminator firing.
- IF core CPI re-accelerates while unemployment rises (TR forming) → cut discretionary withdrawal, raise the cash buffer to the top of its range, shorten duration.
Conditional sustainability ranking (NOT a probability ranking): TL > BL > BR > TR (positive-real-moderate > negative-real-moderate > negative-real-elevated > positive-real-elevated). This states only that if a given regime dominates the horizon, sustainable withdrawal is highest in the Reset and lowest in the Stagflation Fight. It assigns no likelihood; all four retain equal standing.
No-official-future check: No quadrant is designated “most likely” or “official” — equal standing is preserved deliberately; the mode prepares for all four rather than predicting one. The conditional sustainability ranking is explicitly framed as regime-dominance-conditional, not probability, to avoid eroding the anti-prediction stance. Standing warning: most people anchor on whichever scenario resembles the recent past (currently the positive-real-moderate or positive-real-elevated quadrants); that anchoring is precisely the official-future trap this exercise exists to prevent.
Wild card
Four developments sit outside the 2×2 — each would invalidate the matrix rather than occupy a cell within it.
Wild card — Outright deflation / debt-deflation crisis (2008/1930s/Japan-style): negative inflation — neither moderate nor elevated, off the inflation axis entirely. Why it sits outside the matrix: the matrix has no cell for negative inflation; this is the mirror image of Quadrant BR. Indicator that it may be unfolding: cash and long Treasuries winning while everything levered and all real assets crater.
Wild card — AI / energy productivity supershock: the extreme variant of the productivity driving force. Why it sits outside the matrix: a positive supply shock that lifts real growth and real rates while suppressing inflation scrambles the return/valuation and r-vs-g assumptions under every quadrant simultaneously; its moderate variant stays inside the matrix feeding TL/BL, but the extreme variant has no single cell. Indicator that it may be unfolding: real growth and real rates rising together while inflation falls — the combination none of the four quadrants pairs.
Wild card — Longevity / health-cost shock (the personal wild card that matters most here): living to 100 or a large late-life care expense. Why it sits outside the matrix: it invalidates not a quadrant but the 15-year horizon itself — arguably the highest-impact wild card for a retirement portfolio, and the strongest argument for planning to 30 years and for the robust flexibility moves. A 15-year frame concentrates sequence risk early but understates the inflation-compounding and depletion risk of a 30-year reality. Indicator that it may be unfolding: the personal/actuarial signal of health and family-longevity history rather than a market print — which is why it cannot be hedged inside the matrix.
Wild card — Sovereign-debt / currency crisis: a disorderly version of Quadrant BR where repression fails and confidence breaks. Why it sits outside the matrix: it breaks the assumption that domestic bonds are the safe pole at all, so the “safe” leg of a bucket strategy becomes the fragile one — the matrix assumes a stable safe asset and this removes it. Indicator that it may be unfolding: repression-quadrant signals (negative real rates, suppressed yields) accompanied by a breaking currency and a failing bond auction rather than an orderly peg.
Confidence and residual uncertainties
Well-grounded: the scenario causal logic and the robust/scenario-dependent/contingent strategy split.
Verified against official/approved sources (treat figures as illustrative anchors, not a substitute for your numbers): 1980 CPI peak ~14.6% YoY (annual-average ~13.5%); the 1940s–1951 Fed Treasury peg; positive real rates in 2023–25 (FRED 10-yr real ~1.63% as of May 2026); the 1940s negative-real-rate / financial-repression episode; the Morningstar “safer, higher yields / lower fixed-income volatility” framing; Bengen’s 1966-cohort SAFEMAX worst case.
Residual — structural fork (CQ1): that the positive-vs-negative-real split under shared inflation is a causal fork rather than a severity dial is monetary-economics domain judgment; it resolves with a fixed-income/macro reviewer. (The Volcker-1980–82 / 1973–79 re-anchoring makes the fork more empirically legible — two distinct historical episodes rather than one shared decade.)
Residual — axis-2 policy-choice framing (CQ2): in a high-debt world the “choice” to allow vs. suppress positive real rates may be partly forced rather than free; it resolves with an economics reviewer confirming the stance decouples cleanly from the realized inflation level across the horizon.
Residual — terminal vs. transition (CQ1): Quadrant TR is flagged as transition-to-terminal, the other three as dominant regimes; it resolves with you confirming whether each quadrant is read as an end-state or a path.
Live-modeling gap: all portfolio impacts remain qualitative; per-scenario depletion paths and your actual safe withdrawal rate resolve only with real inputs.
These are the assumptions this framework runs on — correct any that are wrong:
- Portfolio: 60/40 stock/bond baseline, nominal bonds. Meaningful TIPS/I-bonds, an annuity, or a pension softens several conclusions.
- Withdrawal: 4% initial, inflation-adjusted, rigid. A dynamic/guardrail rule changes the sustainability verdicts materially.
- Horizon: 15 years (to 2041) as the modeling window; a real plan should assume 25–30+. Whether 15 years is a planning horizon or a life-expectancy assumption is a live decision.
- Stakeholder: single household, no major income outside the portfolio (household-vs-individual affects survivor/longevity planning).
To convert this framework to live modeling, supply: current allocation and balances; age (and spouse’s); annual spending need in today’s dollars, split essential vs. discretionary; any pension/annuity/Social Security and whether inflation-adjusted; your true planning horizon. With these inputs, the next step runs per-scenario depletion paths, tests the actual (not assumed) safe withdrawal rate against each quadrant, and stresses the sequence-risk window.
Mode-switch note: if you want probability weights rather than equal-standing narratives, that is a different tool (probabilistic forecasting) — a deliberate switch away from this mode’s anti-prediction stance.
(visual rendered — see artifact)