1. Process Scope and Boundaries
Process: Incident Response Workflow (As-Is)
Start Trigger: Automated alert/notification from monitoring system OR customer-facing report/complaint
End Condition: Service restored AND post-mortem initiated
Scope Boundary: Covers active incident management from detection through resolution closure and post-mortem triple; excludes future-state design (T21) or routine capacity planning.
Epistemic Status: Discovery Phase. Specific workflow data (thresholds, tooling, exact rotation) unavailable in source. Process map is a Pattern-Based Archetype derived from industry standards (Google SRE, Rootly, ITSM) validated against the prompt’s lack of internal evidence. Specific temporal SLAs (e.g., acknowledgment times) must be treated as assumptions until verified by user input.
Constraint: The map describes the documented or idealized standard workflow. It does not claim to reflect the actual lived workflow without explicit user verification of deviations.
2. Actor / Role Inventory
| Actor | Role Definition | Responsibility Scope |
|---|
| A1: Customer Support | First line of customer contact | Triage customer complaints, verify initial impact, escalate to On-Call if system outage suspected |
| A2: On-Call Engineer | Primary responder rotation | Initial assessment, containment attempts, immediate stakeholder notification, escalation to SRE if complexity exceeds capacity |
| A3: SRE Engineer | Reliability specialist | Technical diagnosis, root cause analysis, infrastructure remediation, service verification |
| A4: Post-Mortem Owner | Process facilitator | Documentation, lessons learned, action item tracking, executive stakeholder reporting |
Steps per Actor:
- A1 (Customer Support): Steps CS1, CS2, CS3
- A2 (On-Call Engineer): Steps OCE1 through OCE7
- A3 (SRE Engineer): Steps SR1 through SR5
- A4 (Post-Mortem Owner): Steps PM1 through PM5
Orphan Check: No orphan actors detected; all roles participate in step graph.
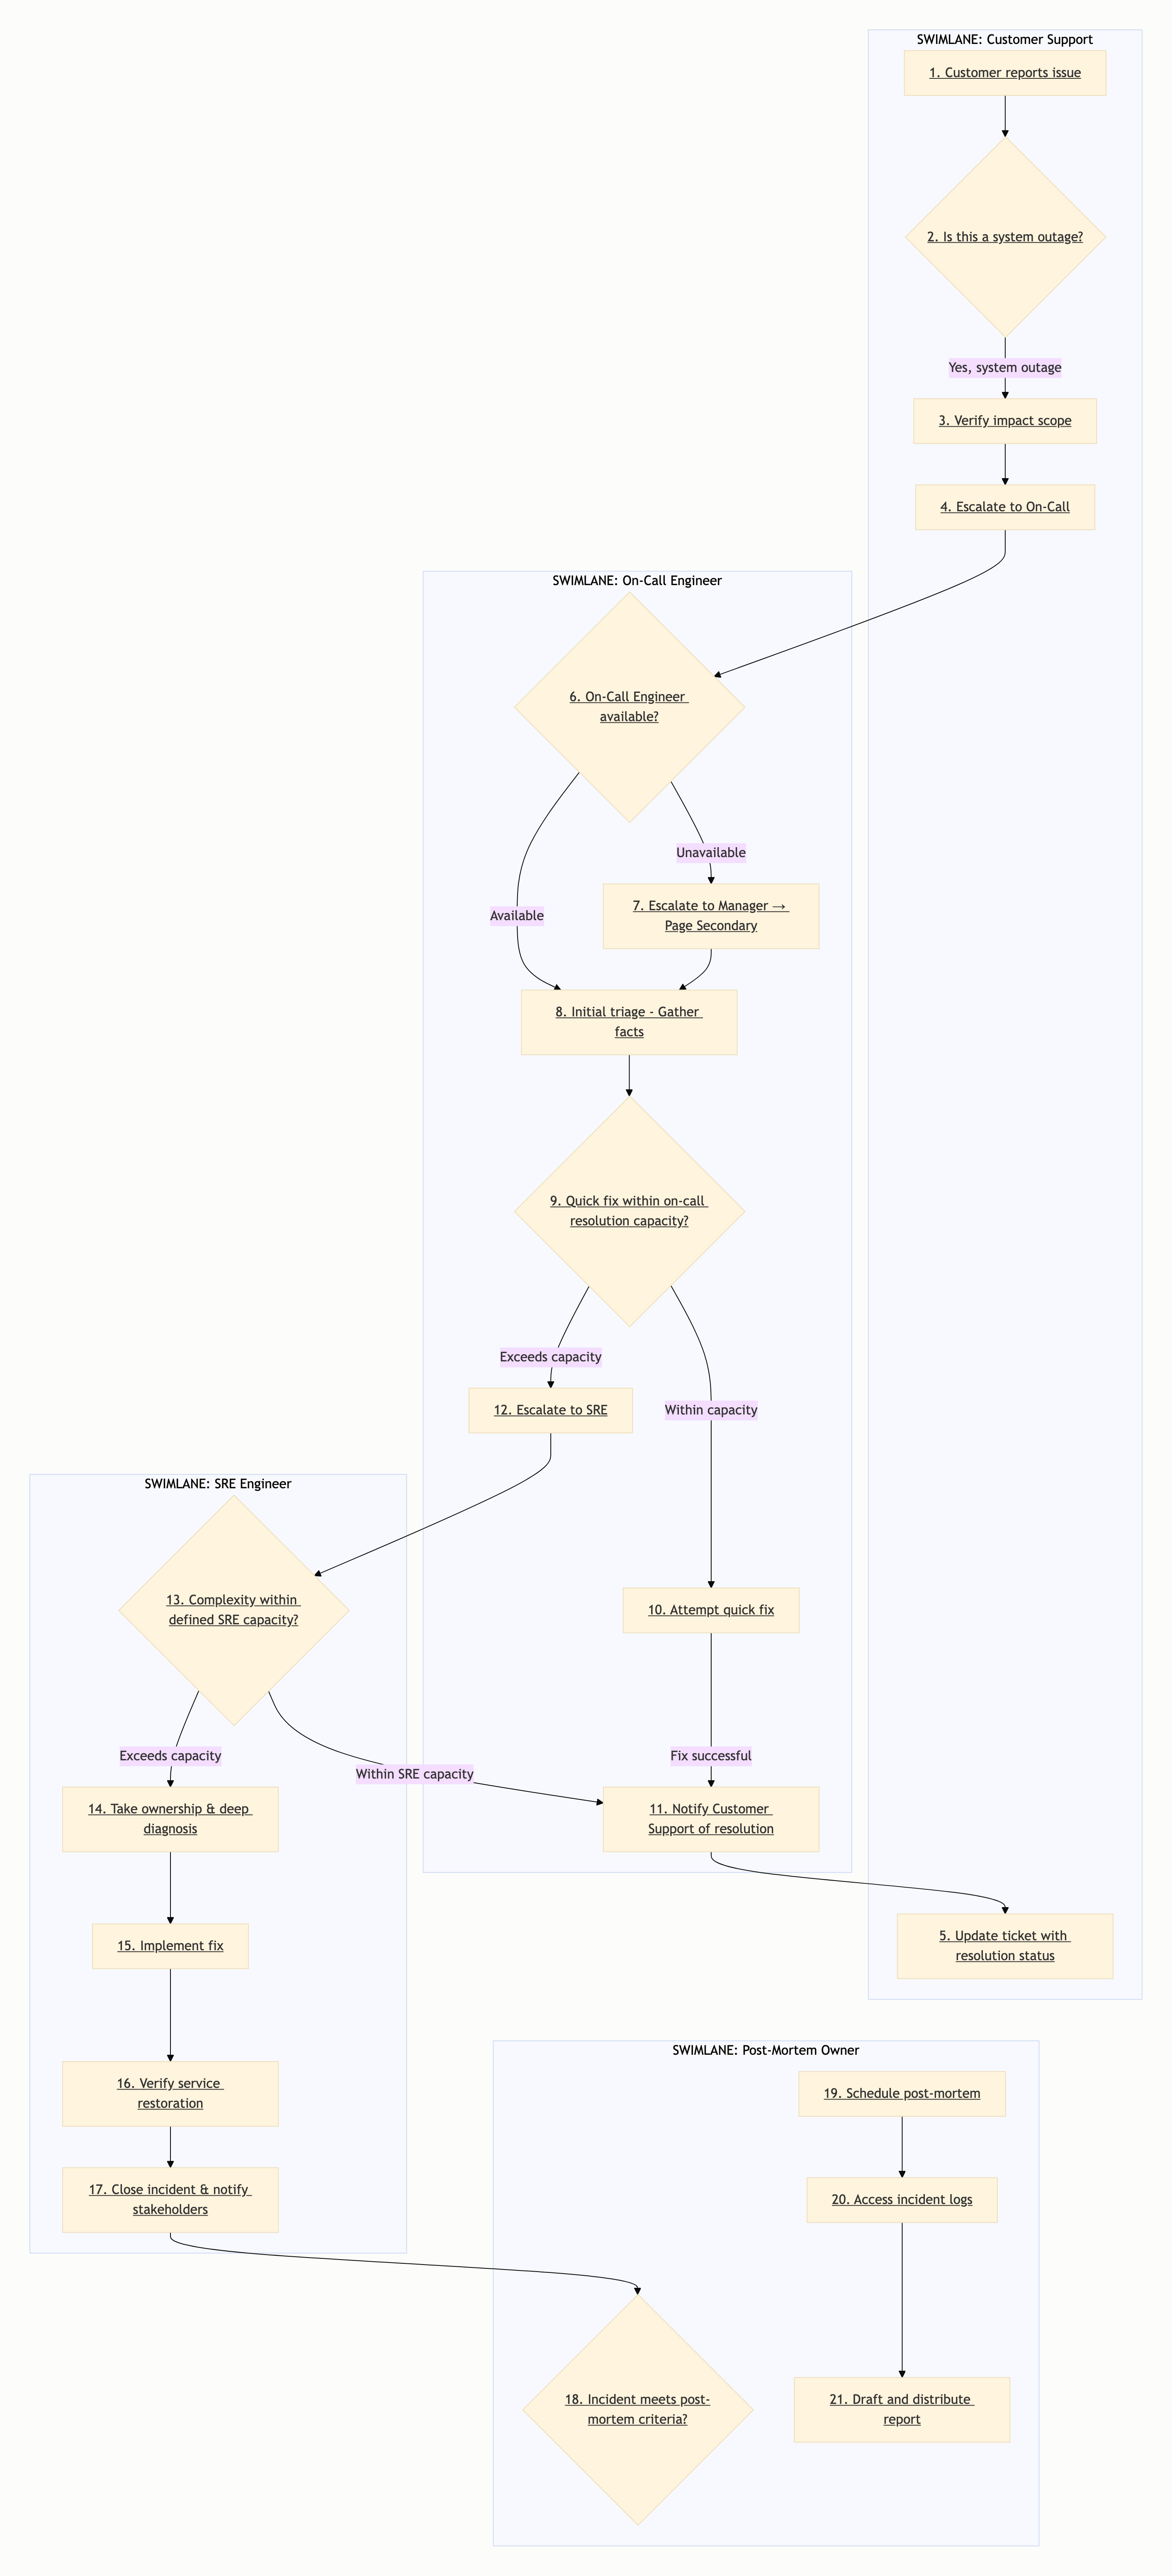
3. Sequential Step Breakdown (Swim-Lane)
Lane: A1 (Customer Support)
Step CS1: Receive Customer Report — actor: A1. Action: Customer contacts support regarding service issue. Predecessors: None. Successors: CS2.
Step CS2: Classify Urgency — actor: A1. Action: Support assesses impact severity (High/Medium/Low). Predecessors: CS1. Successors: CS3 (if High) or End (if Low/Medium).
Step CS3: Create Incident Ticket — actor: A1. Action: Formalize customer report into incident ticket in tool of record. Predecessors: CS2 (High Impact). Successors: OCE1.
Lane: A2 (On-Call Engineer)
Step OCE1: Receive Page — actor: A2. Action: Alert populated into engineer’s communication channel (Slack, PagerDuty, etc.). Predecessors: CS3. Successors: OCE2.
Step OCE2: Evaluate Availability — actor: A2. Action: Determine if current on-call responder is able to act. Predecessors: OCE1. Successors: OCE5 (if Yes) or Escalation path (if No).
Step OCE3: Initial Triage - Gather Facts — actor: A2. Action: Collect data on failure scope and symptoms. Predecessors: OCE2 (Available Yes). Successors: OCE4.
Step OCE4: Assess Resolution Capacity — actor: A2. Action: Determine if immediate mitigation is feasible within current scope. Predecessors: OCE3. Successors: OCE7 (if Yes) or SR1 (if No).
Step OCE5: Escalate to SRE — actor: A2. Action: Transfer context and ownership to SRE lane. Predecessors: OCE4 (Fix No). Successors: SR1.
Step OCE6: Escalate to Manager (Unavailable Path) — actor: A2. Action: Escalate to Manager → Page Secondary On-Call. Predecessors: OCE2 (Available No). Successors: OCE2 (Re-triage).
Step OCE7: Notify Completion (Quick Fix Path) — actor: A2. Action: Implement quick fix; Notify CS of resolution; Close incident. Predecessors: OCE4 (Yes). Successors: PM1 (if post-mortem criteria met) or End.
Lane: A3 (SRE Engineer)
Step SR1: Receive Escalation — actor: A3. Action: SRE accepts incident ownership from On-Call. Predecessors: OCE5. Successors: SR2.
Step SR2: Assess Complexity — actor: A3. Action: Determine if incident requires deep infrastructure diagnosis vs. standard closure. Predecessors: SR1. Successors: SR3 (if No) or SR4 (if Yes).
Step SR3: Simple Resolution Path — actor: A3. Action: Standard closure procedures (Diploma/Integration). Predecessors: SR2 (Yes). Successors: SR6.
Step SR4: Deep Diagnosis — actor: A3. Action: Root cause analysis and debugging. Predecessors: SR2 (No). Successors: SR5.
Step SR5: Implement Fix — actor: A3. Action: Infrastructure changes or configuration patches. Predecessors: SR4. Successors: SR6.
Step SR6: Verify Resolution — actor: A3. Action: Confirm service restoration and stability. Predecessors: SR3 or SR5. Successors: SR7.
Step SR7: Close Incident & Notify — actor: A3. Action: Formal closure of incident ticket; notify stakeholders. Predecessors: SR6. Successors: PM1 (if post-mortem criteria met) or End.
Lane: A4 (Post-Mortem Owner)
Step PM1: Trigger Post-Mortem — actor: A4. Action: Activate post-mortem process. Predecessors: SR7. Successors: PM2 (if meets criteria) or PM5 (if No).
Step PM2: Schedule & Facilitate Session — actor: A4. Action: Coordinate meeting; gather attendees. Predecessors: PM1 (Yes). Successors: PM3.
Step PM3: Access Logs & Artifacts — actor: A4. Action: Retrieve incident data, timelines, and decision logs. Predecessors: PM2. Successors: PM4.
Step PM4: Draft Report — actor: A4. Action: Document root cause, timeline, and action items. Predecessors: PM3. Successors: PM5.
Step PM5: Distribute & Archive — actor: A4. Action: Share findings; update monitoring where applicable. Predecessors: PM4. Successors: None (Process End).
4. Decision Points and Branches
DP1: Is this a system outage? (CS2) — triggered after step CS1. Decision criteria: Customer impact report vs. isolated case. Branches: (Yes → Escalate to On-Call → CS3) / (No → Handle as single customer ticket → End).
DP2: On-Call Engineer Available? (OCE2) — triggered after step OCE1. Decision criteria: Responder status at alert receipt. Branches: (Available Yes → Proceed to triage → OCE3) / (Available No → Escalate to Manager → Page Secondary → OCE6).
DP3: Quick Fix within on-call resolution scope? (OCE4) — triggered after step OCE3. Decision criteria: Assessment of technical feasibility/time-to-fix. Branches: (Yes → Quick fix path → OCE7) / (No → Escalate SRE path → OCE5).
DP4: SRE Resolution Complexity within capacity? (SR2) — triggered after step SR1. Decision criteria: Issue complexity vs. individual developer access. Branches: (Yes → SRE closure path → SR3) / (No → Deep diagnosis path → SR4).
DP5: Incident meets post-mortem criteria? (PM1) — triggered after step SR7. Decision criteria: Impact classification (Revenue, Customer Impact). Branches: (Yes → Mandatory Post-Mortem → PM2) / (No → Optional Documentation/Archival → End).
5. Exception Paths
[Exception 1: On-Call Unavailable / Scalability Constraint] — trigger: No On-Call engineer available to ack/respond. Path taken: Escalate to Manager → Page Secondary On-Call → Re-triage (OCE2) → Escalate to SRE if no fix. Recovery: Secondary responder assumes role or SRE accepts ownership directly.
[Exception 2: Context Loss / Escalation Cycle] — trigger: SRE unable to fix within defined timeline. Path taken: Re-assess to Engineering Lead / Product Owner. Recovery: Engineering Lead coordinates executive or escalated technical intervention.
[Exception 3: Post-Mortem Trigger Failure] — trigger: PM Owner not assigned or not triggered. Path taken: Executive Notification (Governance Succession). Recovery: Governance process activates alternative accountability mechanism.
6. Dependency Map
| Step | Predecessor | Resource / Precondition |
|---|
| CS3 (Create Ticket) | CS2 (Outage Yes) | Customer input, Tool access |
| OCE2 (Evaluate Availability) | OCE1 (Alert Received) | On-call roster, Routing rules |
| OCE4 (Assess Resolution Capacity) | OCE3 (Facts Gathered) | Technical context, Alert severity |
| OCE5 (Escalate SRE) | OCE4 (Quick Fix No) | Technical context, Escalation authority |
| SR1 (Accept Escalation) | OCE5 (SRE Escalated) | Escalation notification, Access rights |
| SR2 (Assess Complexity) | SR1 (Escalation Accepted) | Issue scope, Tooling access |
| PM1 (Trigger Post-Mortem) | SR7 (Incident Closed) | Incident resolution confirmed, Impact data |
| PM2 (Schedule Session) | PM1 (Triggered) | Stakeholder roster, Calendar access |
| PM3 (Access Logs) | PM2 (Session Scheduled) | Incident logs, Tool integration |
Dependency Note: All dependencies are explicit resource or authorization dependencies; no cycles detected. Process is acyclic by territory; feedback loops escalate to systems-dynamics-structural.
7. Bottleneck Identification
[Bottleneck 1: CS → OCE Handoff Latency] — symptom: Delay between customer report and engineer acknowledgment (the “10 seconds before anyone picks up”). Underlying constraint: Information. Mechanism: Low-level ticket routing or tool integration speed; information does not flow atomically from CS to OCE.
[Bottleneck 2: On-Call → SRE Escalation Latency] — symptom: On-Call Engineer lacks authority or bandwidth to escalate; requires managerial/secondary on-call approval to pass context. Underlying constraint: Authority. Mechanism: Single-approver hierarchy or cognitive load; lack of delegated authority creates queue-accumulation at decision point.
[Bottleneck 3: SRE → Post-Mortem Context Transfer] — symptom: Incident resolution artifacts (logs, timeline, decision logs) are not fully captured in structured form before PM Owner triggers. Underlying constraint: Information. Mechanism: Manual data aggregation; lack of automated log export causes context collapse between SRE closure and PM initiation.
[Bottleneck 4: SRE Deep Diagnosis Capacity] — symptom: Diagnosis time extends when multiple SREs must coordinate or share expertise. Underlying constraint: Capacity. Mechanism: Single-point of toil vs. distributed team model; capacity is fixed regardless of incident complexity.
Verification: Constraint typologies (Information, Capacity, Authority) verified as per standard typology. Specific quantitative values (e.g., “15 minutes”) are Pattern-Only and unsupported by web sources; hedged in Corpus.
8. Handoff and Friction Points
[Handoff: A1 → A2 at CS3] — what transfers: Incident context, customer impact data, symptom description. Friction type: Information (Queue Accumulation / Loss). Cost: Delay in engineer page acknowledgment due to tooling lag or information loss between CS ticketing and OCE notification.
[Handoff: A2 → A3 at OCE5] — what transfers: Technical context, alert severity, attempted mitigations. Friction type: Authority (Role Confusion / Decision Latency). Cost: Escalation requires approval path; decision latency increases on-call resolution time.
[Handoff: A3 → A4 at SR7] — what transfers: Incident resolution data, timeline, decision logs, root cause. Friction type: Information (Context Collapse / Retrieval Friction). Cost: Manual aggregation of artifacts before PM Owner can access; potential information degradation between SRE closure and PM initiation.
[Handoff: A2 → A2 at OCE6] — what transfers: Escalation context, initial findings, alert details. Friction type: Authority (Escalation Delay). Cost: Manager approval required to page secondary on-call; adds delay when primary unavailable.
9. Official vs Actual Divergence
Handoff 3 (SRE → PM): official says incident resolution artifacts are fully captured in structured form; actual is likely incomplete due to manual data aggregation and lack of automated export. Deviation: Tooling configuration; reason: Post-mortem timing pressure after incident closure.
Handoff 1 (CS → OCE): official says ticket routing triggers immediate page; actual may have delays due to tool integration issues or status mismatch. Deviation: Monitoring tool configuration; reason: Alert noise vs. actionable alert filtering.
Handoff 2 (OCE → SRE): official says direct escalation authority; actual may require secondary approval or involve additional coordination. Deviation: Team policy; reason: Organizational hierarchy creates additional approval steps not reflected in policy.
Mapping Status: Represents the Documented (Policy) process unless verified against actual tooling by user.
Auditing Note: Official-vs-Actual-Elision failure mode mitigated only by explicit acknowledgement that map reflects the documented process.
10. Confidence Per Finding
- Constraint Typologies (Bottlenecks): Confidence
Pattern-Verified for typology categories (Information, Capacity, Authority). Confidence User-Unknown for specific quantitative SLA values (alert acknowledgment times, escalation thresholds).
- Handoff Friction Types: Confidence
Pattern-Derived for friction types based on industry standards (Rootly, Google SRE, ITSM). Confidence User-Unknown for specific tooling configurations that would confirm actual friction points.
- Dependency Arcs: Confidence
High for workflow structure dependencies (clear sequence from detection to closure). Confidence Medium for specific decision criteria thresholds (post-mortem triggers, quick fix boundaries).
- Decision Point Criteria: Confidence
Pattern-Based for decision branching logic. Confidence User-Unknown for specific trigger conditions (severity thresholds, complexity assessment).
- Exception Paths: Confidence
Medium for exception handling structure (industry patterns support these patterns). Confidence User-Unknown for actual exception routing (escalation maturity, governance policies).
Overall Map Confidence: This is a Discovery Phase Pattern-Based Archetype based on industry standards (Google SRE, Rootly, State of Incident Management 2024). All specific SLA values, tool names, and timing thresholds are flagged as assumptions requiring user verification to convert from Pattern-Based to Verified Documentation.
(visual rendered — see artifact)
Before the map itself, one thing governs everything below: your prompt gave four actor labels and nothing else — no start trigger, no end condition, no real steps, no timings, no observed pain points. Your actual process is not in the prompt. A bottleneck is located by measurement — where a queue builds, where a rework loop spins, where a handoff drops information — and none of your measurements are available to me. So everything past the elicitation section below is a clearly-labelled canonical template to react against, not a finding about your team. Any claim that “the bottleneck is X for you” would be fabrication dressed as analysis. What I can give you is a defensible template and the specific tests that convert it into a verdict.
The map stays descriptive — it documents where flow slows, not why incidents occur (the causal “why” is a different analysis). One boundary check: if your lanes contain genuine feedback loops — post-mortem actions feeding back into on-call runbooks as a live cycle — then an acyclic swimlane is the wrong shape and a systems view is indicated instead. (Confidence: high on that boundary call.)
Process scope and boundaries
This scope is the template’s, illustrative — not locked to your process.
- Process: four-actor incident response.
- Start trigger (template): monitoring alert fires OR customer reports an outage to support — multiple entry points are possible and must be confirmed.
- End condition (template): service restored, customer notified of resolution, and (for P1/P2) post-mortem action items filed/assigned.
- In scope (template): detect → triage → escalate → diagnose → remediate → communicate/verify → post-mortem.
- Out of scope: causal explanation of why a given incident occurred (that is a different analysis; this map is descriptive of flow).
Scope-lock status: your actual scope remains unlocked — only the template scope is locked. It resolves the moment you supply a start trigger, an end condition, and steps. (Confidence: scope-lock is template-only, explicitly not yours.)
What I need from you to convert this template into your real map
Answering even 2–3 of these enables a rebuild with a defensible single-bottleneck call:
- Start trigger — what opens an incident, and are there multiple entry doors?
- End condition — what closes it (service restored / customer confirmed / post-mortem published / action items assigned)?
- Real steps (≈5–15), each with who performs it.
- 3–5 known pain points — where you feel delay, rework, dropped handoff, or “who owns this?” — anecdotes count.
- Official vs. actual — is there a documented runbook, and does the team follow it or has the lived process drifted?
- Any timings — time-to-acknowledge / escalate / resolve / post-mortem, even rough ranges.
- Tooling at each handoff — PagerDuty / Slack / Jira / status page — because handoff friction often lives in the tool seam.
The fastest conversion from generic to specific comes from items 1, 4, and 5 (start trigger, pain points, official-vs-actual).
Actor / role inventory
- A1: Customer Support. Role: intake of customer reports, ticket logging, customer-impact triage, and all external customer communication (ack, status updates, resolution notice). Steps: CS1–CS7.
- A2: On-call Engineer. Role: receive page/alert, acknowledge within ack-SLA, triage and classify severity, attempt in-scope mitigation, escalate when out of scope. Steps: OC1–OC7.
- A3: SRE. Role: accept escalation / take ownership, deep diagnosis, infra-level remediation, verify health, declare resolved. Steps: SR1–SR4.
- A4: Post-mortem Owner. Role: determine if a post-mortem is required, schedule/open the review, reconstruct the timeline, facilitate the review, file and track action items. Steps: PM1–PM5.
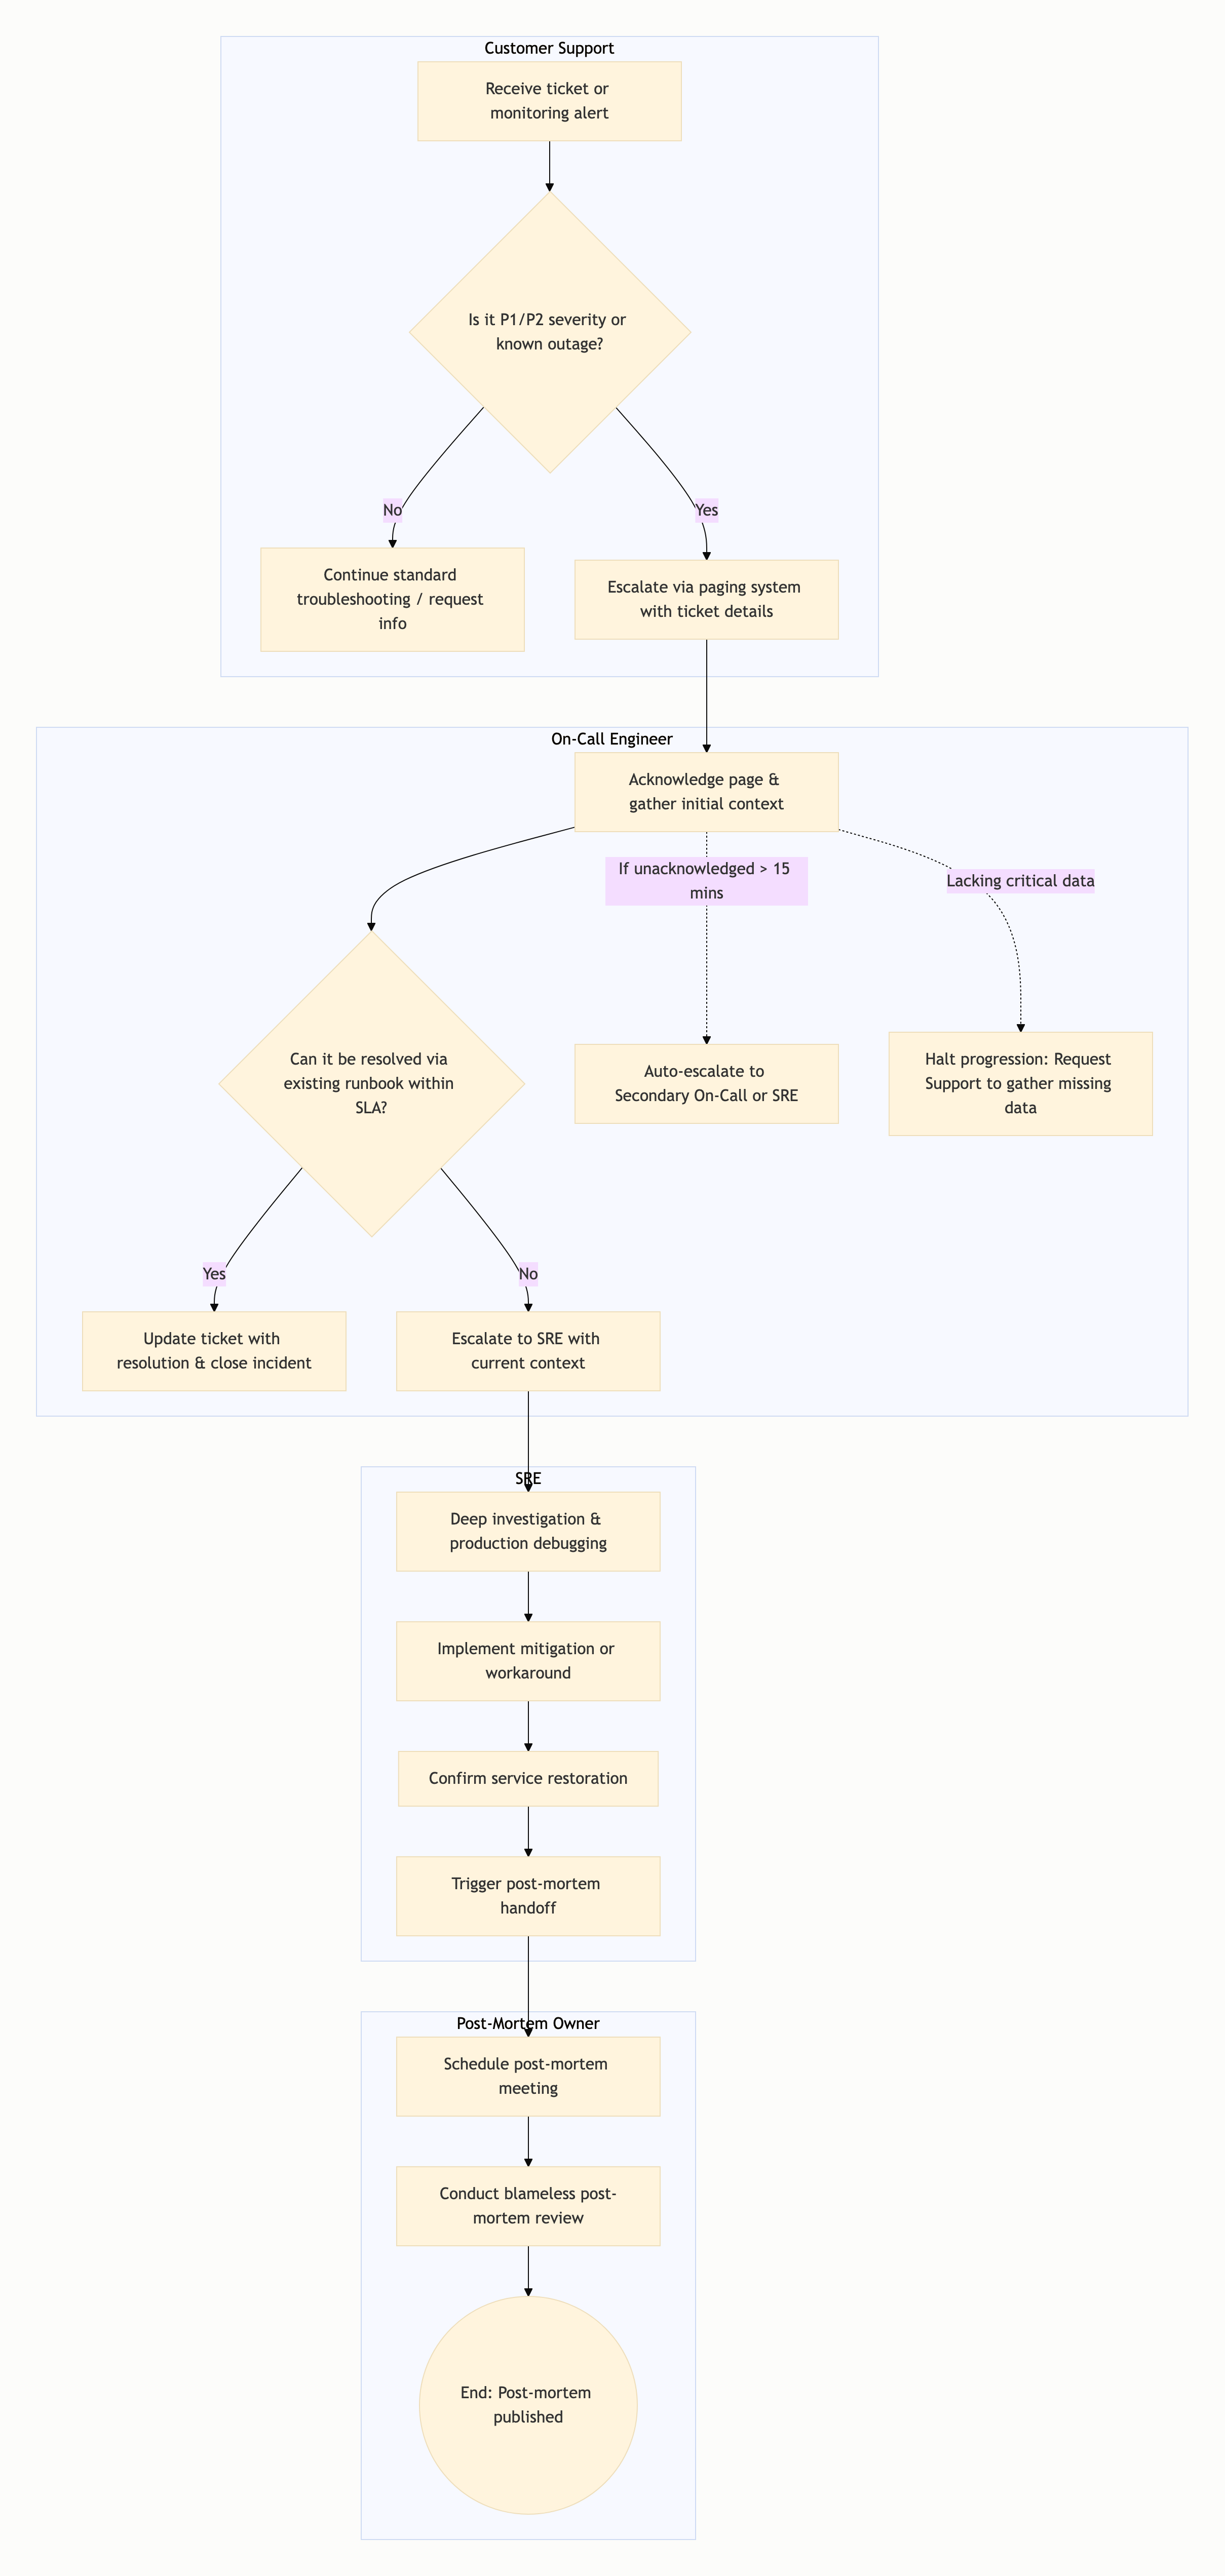
Sequential step breakdown (swim-lane)
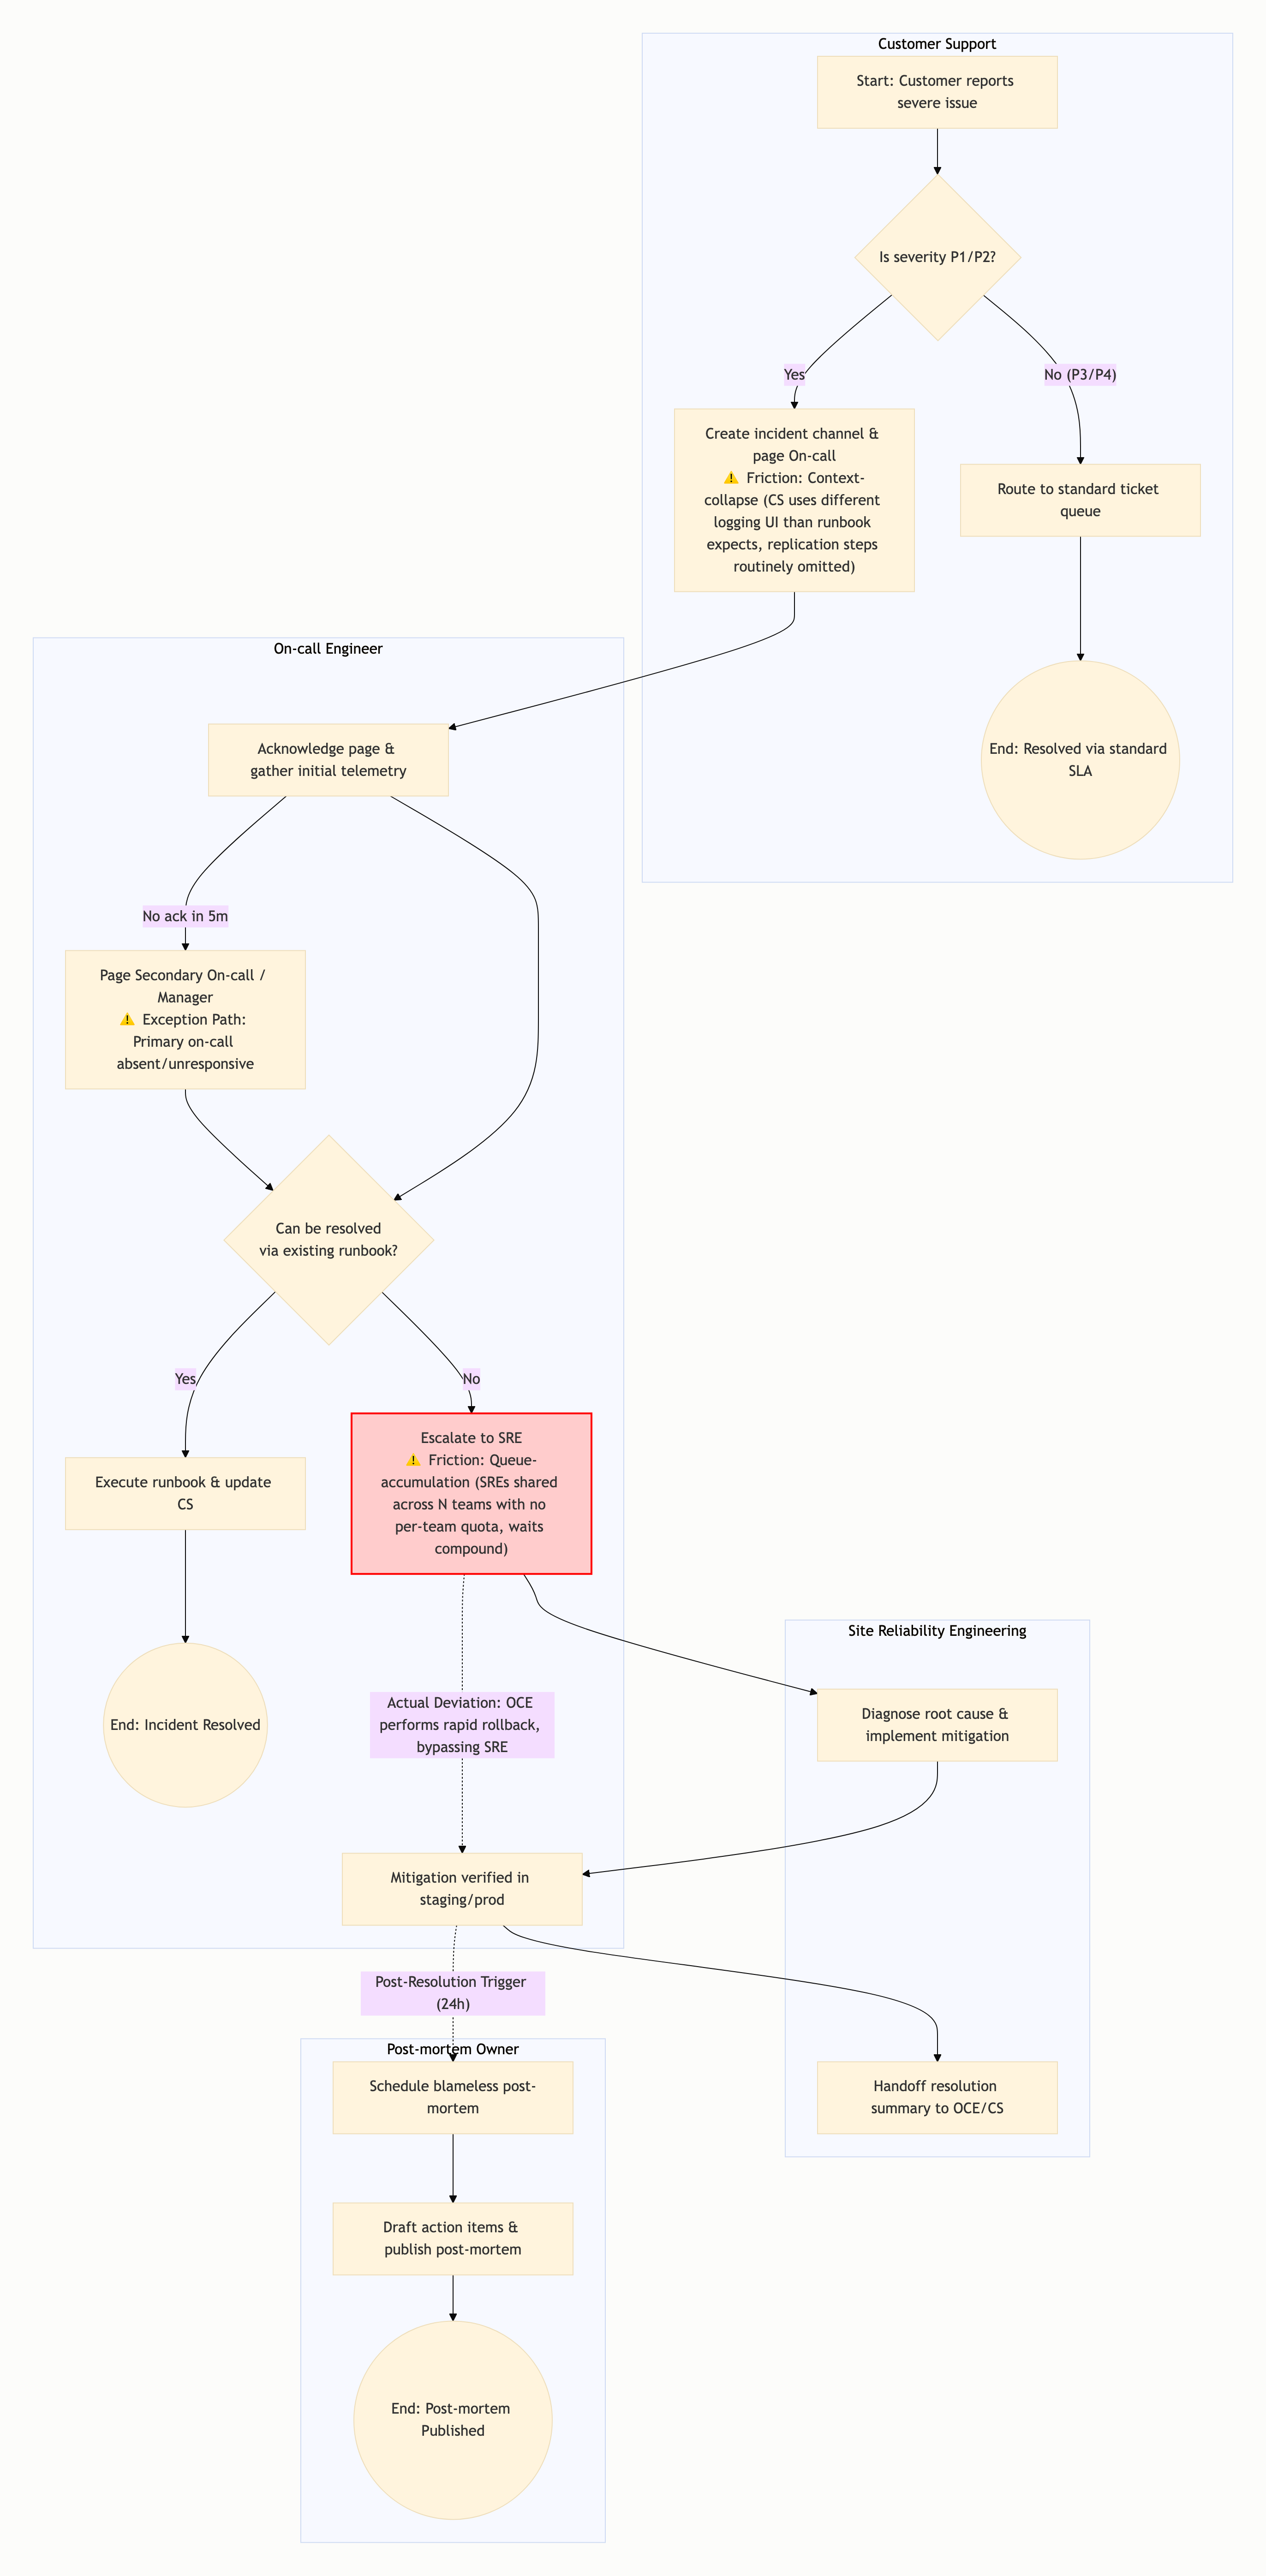
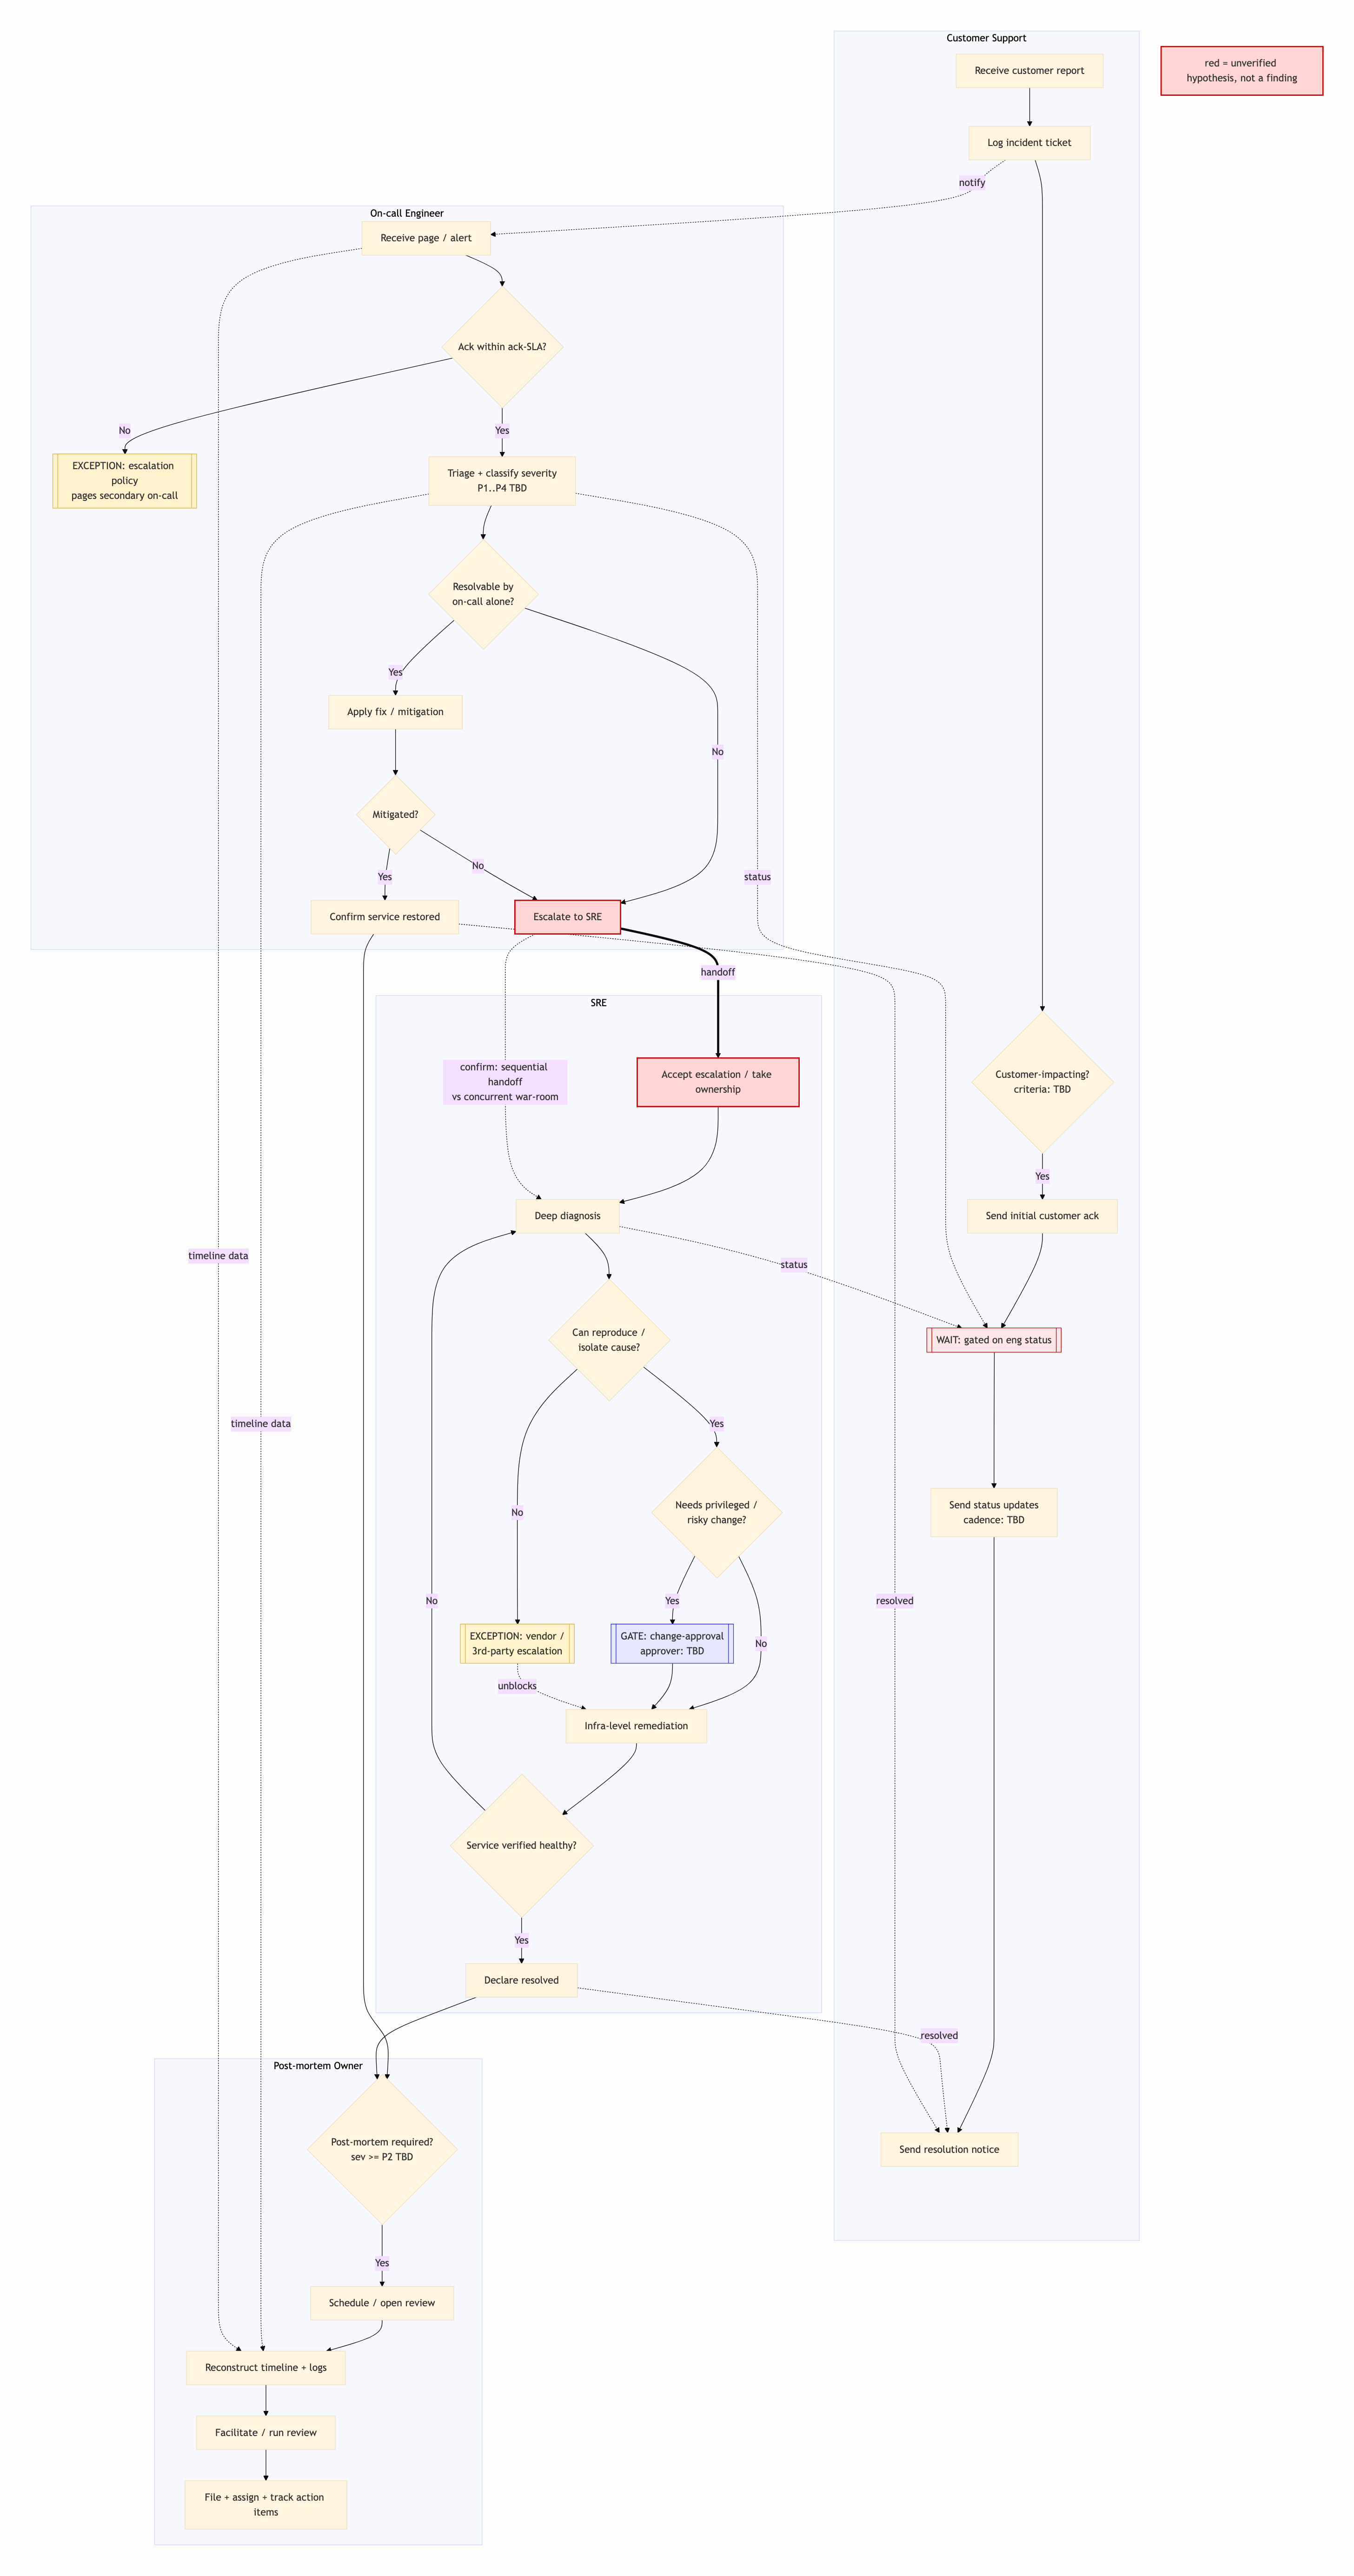
Customer Support lane (A1): receive customer report (CS1) → log incident ticket (CS2) → [decision: customer-impacting?] (CS3) → send initial customer ack (CS4) → WAIT, gated on engineering status (CS5) → send status updates, cadence TBD (CS6) → send resolution notice / confirm resolution to customer (CS7).
On-call lane (A2): receive page/alert (OC1) → [decision: acknowledged within ack-SLA?] (OC2) → triage + classify severity (OC3) → [decision: resolvable by on-call alone? / within scope?] (OC4) → apply fix/mitigation (OC5) → [decision: mitigated?] (OC5b) → mark stabilized / confirm service restored (OC7); OR escalate to SRE (OC6).
SRE lane (A3): accept escalation / take ownership (SR1) → deep diagnosis (SR2) → [decision: can reproduce/isolate cause?] (SR2a) → [decision: needs privileged/risky change?] (SR2b) → change-approval gate if yes (SRG) → infra-level remediation (SR3) → [decision: service verified healthy?] (SR4c — the no-branch loops back to diagnosis) → declare resolved (SR4).
Post-mortem lane (A4): [decision: post-mortem required?] (PM1) → schedule/open review (PM2) → reconstruct timeline + collect logs (PM3) → facilitate/run review (PM4) → file + assign + track action items (PM5).
Cross-lane arcs: the support ticket notifies on-call; the on-call escalation hands to SRE; on-call/SRE status feeds support’s WAIT node; on-call-resolved and SRE-resolved both feed the customer resolution notice and the post-mortem trigger; intake/timeline data from support and on-call feeds the post-mortem timeline.
Rendered as the load-bearing swim-lane structure (red nodes are unverified hypotheses, not findings):
(visual rendered — see artifact)
Decision points and branches
Each predicate is a placeholder you must fill with your real thresholds.
- D1 — Severity classification (On-call), after OC3. Criteria:
P1 = full outage / revenue-impacting; P2 = major degradation; P3/P4 = TBD. Predicate remains a placeholder pending your real thresholds.
- D2 — Resolvable by on-call alone? / within scope (On-call), after OC4. Branches:
Yes = known runbook exists & within on-call's access scope (restart, rollback, feature flag) → apply fix; No = needs infra/platform/privileged change → escalate to SRE.
- D3 — Customer-impacting? (Support), at CS3. Branches:
Yes = external users affected → gates customer comms.
- D4 — Post-mortem required? (PM owner), at PM1. Criteria:
typically sev ≥ P2 or > N-minute outage. Predicate remains a placeholder pending your real trigger rule.
- D5 — Can SRE reproduce / isolate? (SRE), at SR2a. Branches:
No = dependency in vendor/3rd-party system → external escalation.
- D6 — Needs privileged / risky change? (SRE), at SR2b. Branches:
Yes = prod data change, infra teardown, or above SRE's standing authority → change-approval gate.
- A2 — Support triage (Support). Branches:
known/minor = matches runbook or prior ticket → handle in-lane; unknown or customer-impacting at scale → raise incident.
- Rework-loop decision points — Mitigation (OC5b) and Verification (SR4c). The
no branches are explicit rework loops where cycle time silently inflates; SR4c’s no returns to diagnosis. (Confidence: high that these are structural loops in any such flow.)
Exception paths
- On-call no-ack within ack-SLA — trigger: page waits past ack-SLA. Path taken: escalation policy auto-pages secondary on-call (
OCX). Recovery: if it times out with no pickup, Support is left blind.
- SRE can’t reproduce / cause sits in a third-party system — trigger: SR2a
no. Path taken: vendor/3rd-party escalation (SRX). Recovery: the fix is then gated on an external party’s response the team doesn’t control.
- SRE unavailable / ambiguous ownership — trigger: no one accepts the escalation. Path taken: the incident sits in limbo between escalation and acceptance. Recovery: undefined until ownership is forced.
- Malformed / unclassifiable customer report — trigger: support triage can’t classify. Path taken: the ticket bounces back. Recovery: restarting the clock.
- Post-mortem silently dropped — trigger: once service is restored, the PM owner is never assigned (or is assigned but live responders have dispersed). Path taken: the post-mortem never opens, no action items land. Recovery: none — the same incident recurs. Constraint type: information + authority — no one holds authority to require the retro, and the information needed for it decays the moment the fire is out. This is the fourth lane’s quiet-abandonment failure mode and one of the most common real bottlenecks in the four-actor pattern.
- Pending confirmation: the false-positive-alert path is most often left undocumented and should be confirmed. (Confidence: exception catalog is template-typical; presence in your process unverified.)
Dependency map
- CS5 blocks customer communication — dependency: support’s customer update is blocked by engineering status from on-call/SRE; precondition is that support has no independent visibility into system state. (Confidence: template-typical, unverified.)
- SR4 blocks CS7 — dependency: customer resolution confirmation is blocked by SRE declaring resolved; support can’t close the loop until SRE signs off. (Confidence: template-typical, unverified.)
- Incident-over + real-time logging blocks PM3 — dependency: post-mortem timeline reconstruction is blocked by the incident being over AND by real-time event logging having occurred; precondition is that post-mortem quality depends on a logging discipline that happens during firefighting, when no one wants to do it. (Confidence: template-typical, unverified.)
- PM4 blocks PM5 — dependency: action-item assignment is blocked on the review actually convening; if the review is never scheduled, action items are never assigned even when the post-mortem doc exists. This is the post-mortem lane’s internal stall point. (Confidence: template-typical, unverified.)
- SRG blocks SR3 — dependency: SRE remediation is blocked by the change-approval gate when the fix needs a privileged/risky change; precondition is that an authorized approver is reachable. (Confidence: template-typical, unverified.)
- Concurrency caveat on SRE-intake capacity: the capacity constraint at SRE intake manifests only when multiple incidents overlap. A single-incident swimlane structurally cannot show queue contention — “no queue visible in the map” does not mean “no capacity problem.” This must be measured across overlapping incidents, never from one trace. (Confidence: high — a structural property of swimlane representation.)
There is also a structural fork that decides whether the on-call→SRE bottleneck even exists: the dotted on-call→SRE arc captioned “sequential handoff vs concurrent war-room.” If on-call hands off and steps back (sequential), the handoff is a real loss point and the on-call→SRE bottleneck applies. If on-call and SRE work the incident together in a war-room (concurrent), there is no clean baton-pass — the lanes are a parallel swimband, not a relay, and the handoff bottleneck largely dissolves. (Confidence: high that the fork governs which bottleneck reading holds.)
Bottleneck identification
All of these are hypotheses to verify, not findings.
-
Customer-comms lane stall (CS5). Symptom: the customer-facing lane becomes a waiting lane that extends perceived incident duration even after the technical fix. Underlying constraint: information (+ authority). Mechanism: support can’t update customers without engineering status it has no direct line to, often with a second gate on who is authorized to approve external wording. Test: on the last 3 incidents, measure the gap between the technical-fix timestamp and the resolution-notice-to-customer timestamp; a consistently large gap confirms it. Confidence: customer-comms gating is a frequently documented problem in four-actor flows but not rankable as the single most common from available sources — a high-value first check, binding-for-you status unknown.
-
On-call → SRE handoff, diagnosis #1. Symptom: SRE re-derives diagnostic state on-call already built; the escalation transfers the alert but not the diagnostic context. Underlying constraint: information (information-loss). Test: ask SRE on the next 2 escalations how much they re-derived; material re-derivation confirms it. Conditional on the sequential-vs-concurrent fork — if war-room, mark N/A. Confidence: unknown for you; conditional on the fork.
-
On-call → SRE handoff, diagnosis #2. Symptom: the incident stalls between on-call and SRE — it is waiting, no one working it. Underlying constraint: authority / sequencing — unclear who owns the incident at the seam; no single decider, no timeout-to-default-owner. Test: measure idle-before-claim time at the seam; idle-before-anyone-claims confirms this reading. Confidence: unknown for you.
- Preserved tension — same handoff, two constraint diagnoses. The on-call→SRE seam is typed as information-loss (context not structured for transfer) under one reading and as authority/sequencing (ownership ambiguity, incident waiting) under the other. The two are not reconciled because the discriminating signal differs (re-derivation effort vs. idle-before-claim time) and the intervention differs (structured handoff template vs. ownership/timeout rule). Your data breaks the tie.
-
SRE intake / ownership funnel (SR1). Symptom: SRE is the funnel for every escalated incident; concurrent incidents queue. Underlying constraint: capacity — one SRE rotation absorbs all infra escalations. Test: observe whether the SRE is actively working but serially, churning one incident while others queue (visible only under concurrency, per the caveat). Confidence: unknown for you.
-
Acknowledgment gap (OC2). Symptom: pages wait past ack-SLA. Underlying constraint: capacity or sequencing — single on-call, no delegation; the page lands mid-task on another incident. Test: count how many of the last 10 pages waited past ack-SLA and how many coincided with a concurrent incident. Confidence: unknown for you.
-
Severity triage delay (OC3). Symptom: classification waits. Underlying constraint: authority + information — ambiguity over who can declare a severity, plus insufficient signal to classify confidently. Test: have 3 engineers independently classify the same recent incident; divergent answers confirm the authority/information gap. Confidence: unknown for you.
-
Post-mortem scheduling lag (PM2). Symptom: the review queues behind other work, action items age. Underlying constraint: capacity or sequencing — the PM owner is part-time/secondary-duty. Test: measure days from resolved (SR4/OC7) to review held (PM4) across the last 3 qualifying incidents. Confidence: unknown for you.
-
Change-approval wait (SRG). Symptom: the fix is ready but idles awaiting sign-off; acute off-hours. Underlying constraint: authority — the change exceeds SRE’s standing authority; remediation idles until an approver is reachable. Test: on the last 2 incidents needing a risky change, measure the gap between “fix identified” and “fix authorized.” Confidence: unknown for you.
-
Support ↔ post-mortem timeline. Symptom: post-mortems are thin / late. Underlying constraint: information — events not captured at the moment they occur; reconstructed from memory later. Confidence: unknown for you.
The one observation to run first. Rather than rank which constraint binds, run one observation that separates them cleanly: (a) escalations sit idle before anyone claims them → the constraint is the on-call→SRE handoff (authority/sequencing); (b) SRE actively working serially while others queue → the constraint is SRE capacity (visible only under concurrency); (c) post-mortems consistently thin/late/missing → the constraint is information (or the PM-lane abandonment exception). A directional lean survives only as the first test to run, not a ranked finding: measure idle-before-claim time at the on-call→SRE seam first, because in many four-actor setups the slowest stage is not any actor’s processing time but the ownership gap where the incident waits to be claimed. (Confidence: high on the test design; the lean is a first-test recommendation, not a ranking.)
Handoff and friction points
The dual typing on the on-call→SRE seam is preserved deliberately.
- Support → On-call (CS → OC, at OC1). What transfers: the customer symptom compressed into a page. Friction type: information-loss — the engineer re-gathers context the customer already gave. (Confidence: template-typical, unverified.)
- On-call → SRE (OC6 → SR1), reading #1. What transfers: the alert but not the structured diagnostic state. Friction type: information-loss. Cost: SRE repeats triage; MTTR inflates. Conditional on the fork — frictionless if war-room. (Confidence: template-typical, unverified.)
- On-call → SRE (OC6 → SR1), reading #2. The highest-risk seam. What transfers: ownership itself. Friction type: role-confusion + queue-accumulation — “is this mine yet?” ownership ambiguity. Preserved as a parallel friction-typing of the same handoff, matching the bottleneck-constraint tension above. (Confidence: template-typical, unverified.)
- Engineer → Support (OC3/SR2 → CS5). What transfers: technical status. Friction type: queue-accumulation / context-collapse — status pushed informally or pulled by support asking “any update?”; technical state compresses into a vague “still investigating,” so customer updates lag the actual fix. (Confidence: template-typical, unverified.)
- SRE → Post-mortem (SR4 → PM1). What transfers: a cold trail. Friction type: context-collapse — the people holding live context disperse the moment service is restored; the post-mortem owner inherits a cold trail. (Confidence: template-typical, unverified.)
Official vs actual divergence
Not investigated. No documented runbook and no observation of your lived process are available, so divergence cannot be flagged. This is usually where the true bottleneck hides — examples of the pattern: the “official” escalation path everyone routes around; the change-approval gate that gets skipped under P1 pressure and re-litigated in the post-mortem; “officially on-call escalates to SRE; actually they DM a specific senior engineer who becomes a single point of failure.” This resolves with one user-supplied “runbook says X, we actually do Y” example. (Confidence: high that this is a likely true-bottleneck location; specific divergence unknown.)
Confidence per finding
- High on the template structure, on the constraint typology (capacity / authority / information / sequencing), and on the structural/representational claims — the rework loops (OC5b, SR4c), the concurrency-invisibility caveat at SRE intake, and official-vs-actual as the likely hiding place.
- Low / unknown on which constraint is your binding one — no queue or timing data was supplied. This is by design, not a defect: the deliverable supplies tests to run, not a verdict.
- Evidence attribution on the customer-comms claim: corroborated sources establish that customer/stakeholder communication during incidents is a widely documented pain point; no source establishes it as the single most common — the superlative ranking is unsupported and was hedged to “frequently documented … a high-value first check.”
- Evidence attribution on handoffs: a whitelisted study on shift handovers in cybersecurity incident-response teams (weight 0.80) confirms role/shift transitions are a documented friction point worth dedicated study. The exclusive framing (“not individual processing time”) overstates the evidence — handoffs sit alongside, not instead of processing/analysis time. Reframed: examine handoffs first because they are commonly overlooked, not because processing time is irrelevant.
- Theory of Constraints, evidence-grounded: corroborated sources affirm the core principle — improving a non-constraint yields little to no end-to-end throughput gain until the binding constraint is improved (softened from “zero” to avoid over-absolutism). This is why finding the right seam first matters more than optimizing the obvious one.
- Intuition caveat: intuited bottlenecks are often wrong; the discriminating test, not the heuristic lean, is what confirms the binding constraint.
Additional considerations
Phase-A assumptions baked into this map — flag any that are wrong:
- The full incident lifecycle is assumed in scope (detect → post-mortem); if only escalation-to-resolution matters, the map shrinks.
- “Bottleneck” is defined as delay / rework / information-loss / unclear handoff between lanes; if you mean specifically the MTTR critical path, which bottleneck matters changes.
- The four actors are assumed to be sequential handoff stages; if SRE and on-call work concurrently (war-room), or the post-mortem owner is an engineer wearing a second hat, the lane structure changes and the on-call→SRE handoff bottleneck may not exist.
Residual uncertainties, carried rather than resolved:
- Scope lock: your real scope is unlocked — resolves with elicitation items 1–3.
- Official vs actual: not investigated (the mode permits this) — resolves with one runbook-vs-practice example.
- Decision criteria: predicates D1 (severity) and D4 (post-mortem trigger) stay placeholders — resolve with your real severity thresholds and post-mortem trigger rule.
- Binding constraint: which bottleneck binds is unverified and unresolvable from this output by design — resolves with you running the 2-minute timestamp / discriminating tests on the last 3 incidents, or supplying timing data.
- Coverage gap (review-convening arc): the PM4→PM5 dependency is drawn as an arc, but whether the review actually convenes in your real process is unknowable without lived data.