Here’s the system mapped as a stock-and-flow, then the loop structure, then the archetype.
Stock-and-flow
   Revenue inflow                              Payroll outflow
   ════════►╗                                ╔════════►
            ║          ┌──────────────┐       ║
            ╠═════════►│              │═══════╣
            ║          │     CASH     │       ║
            ╠═════════►│  (the stock) │═══════╣
            ║          └──────────────┘       ║
   ════════►╝                                ╚════════►
   Fundraising inflow                          Opex outflow

   Net flow (dCash/dt) = (Revenue + Fundraising) − (Payroll + Opex)
Two faucets fill the tank (revenue, fundraising), two drains empty it (payroll, opex). Cash is the only true stock — everything else is a rate. The level matters more than any single flow: you can survive negative net flow for exactly Cash ÷ net burn months. That quotient is runway, and it’s the variable every loop below is really steering.
Loops
R1 — Growth engine (reinforcing, delayed). Cash funds payroll + opex → builds product/sales capacity → Revenue rises → refills Cash. This is the loop you want to dominate. The delay (hire-to-output, sales cycle) is what makes it dangerous: you pay the outflow now, the inflow arrives quarters later.
B1 — Burn discipline (balancing). Cash falls → runway alarm → cut payroll/opex → outflow drops → Cash stabilizes. The self-correcting loop that keeps you alive on your own steam.
B2 — Fundraising top-up (balancing, delayed). Cash falls → trigger a raise → Fundraising inflow → Cash jumps. Fast relief, but the loop closes slowly (raises take months) and its gain depends on traction.
R2 — Traction → funding (reinforcing). Revenue growth → better metrics → easier/larger raise → more Cash → more growth spend → more Revenue. The flywheel investors are betting on; also the loop that can mask weak unit economics.
            ┌────────────── R1 (delayed) ──────────────┐
            ▼                                           │
  Cash ──► spend (payroll+opex) ──► capacity ──► Revenue ──┘
   │ ▲                                              │
   │ └────────── B2 (raise, delayed) ───── Fundraising
   │                                              ▲
   └── low runway ──► cut burn (B1)               │ R2
            └────────── Revenue/traction ─────────┘
Senge archetype: Shifting the Burden
It’s visible, and B1/B2 are exactly its two competing fixes.
| Role | Loop | What it does |
|---|
| Symptom | — | Cash running low (short runway) |
| Symptomatic fix | B2 fundraising | Fast, refills the tank — but treats the level, not the leak. Side effect: dilution + growing dependence on external capital. |
| Fundamental fix | B1 + R1 margins | Get Revenue > (Payroll + Opex) — reach default-alive. Slow, harder, addresses the cause. |
The trap: every successful raise relieves the pressure that would have forced the fundamental work (margins, burn discipline). The capability to run lean atrophies, dependence on the next round deepens — the classic reinforcing side-effect loop that makes the symptomatic fix self-perpetuating.
Where to intervene (highest leverage first): watch net burn and runway, not gross cash; time B2 from strength (R2 traction) rather than from the B1 alarm; and treat each raise as buying time to fix R1’s unit economics, not as the fix itself.
One thing I’d flag before you take this as gospel: whether this is really Shifting the Burden depends on a fact I don’t have — is fundraising your reflex when cash dips, or a planned, traction-timed event? If the latter, R2 is your dominant loop and there’s no pathology here. Want me to render this as an actual stock-and-flow visual (ora-visual envelope), or fold in real numbers if you have the monthly rates?
Here is the structural model for a company’s cash position based on the four specified flows. I have constructed a standard Stock and Flow Diagram (SFD) using Mermaid code, followed by an analysis of the feedback loops and Peter Senge Archetypes.
1. Stock and Flow Diagram
In this system, Cash Position is the Stock (accumulation). The Flows are the rates of Change over time.
The diagram includes implied poles of intensity or auxiliary variables (like “Runway Left” or “Talent/Human Capital”) because a Cash-only diagram is static; a dynamic systems diagram must connect the inputs to the resulting Stock health.
flowchart TD
    %% Stocks
    Stock1((Stock: Cash Position))

    %% Flows
    FlowRev[Revenue Inflow]
    FlowFund[Fundraising Inflow]
    FlowPay[Payroll Outflow]
    FlowOpx[Opex Outflow]

    %% Relationships / Connectors
    Stock1 --> |Controls| FlowPay
    Stock1 --> |Controls| FlowOpx
    FlowPay --> |Driven By| Stock1
    FlowOpx --> |Driven By| Stock1

    FlowRev --> Stock1
    FlowFund --> Stock1

    FlowPay -- "Subtracts" -.-> CashBalance[Imputed: Cash Burn Rate]
    FlowOpx -- "Subtracts" -.-> CashBalance

    CashBalance --> |Inversely Proportional| FLY

    %% Feedback Loops
    subgraph Loops
    L1[Loop L1 (Burnout Loop)]
    L2[Loop L2 (Growth Loop)]
    end

    subgraph Archetypes
        Arch[Archetype: Shifting The Burden]
    end

    %% Diagram Mapping
    Stock1 -- |- Reduction|--> L1[Low Cash]
    L1 --> |Pressure| Stock1
    L1 -.- L2["Pressure to Grow/Spend"]

    FlowRev -- |Revenue Growth|--> Tim[Time To Runway]
    FlowFund -.-| "Fixes Cash Shortage" --> Tim
Legend & Notation:
- Bracket
[ ]: Flows (Rates in/out)
- Double Circle
(( )): Stocks (Accumulations)
- Arrow
-->: Positive Influence
- Cloud/Line
---: Relationships not quantifiable in pure flow
- Thick Arrow: Macro impact
2. System Loop Mapping
To make the system dynamic, we implicitly add Time (Runway) to the diagram, as cash is measured in time-units per bank-loan or savings circuit.
Loop 1: The “Cash Flow Breach” (Balancing Loop)
- Path:
Cash Position ↓ causes Credit Score/Investor Confidence ↓ → Fundraising Outflow ↓ → Cash Position ↓ Faster.
- Effect: This is a natural Balancing Loop (L1). It stabilizes the system by forcing cost-cuts or fundraising when cash hits a threshold.
- Role: Limits to Growth (bankruptcy floor).
Loop 2: The “Operating Cycle” (Reinforcing Loop R1)
- Path:
Cash Position ↑ allows Opex/Payroll (Investment) ↑ → Revenue Inflow ↑ → Cash Position ↑.
- Effect: This is a Reinforcing Loop (R1). It signifies the growth of the business. Money begets more money through reinvestment into payroll (growth) and operations (scale).
- Role: The primary driver of expansion, provided R1 speed > L1 speed.
3. Peter Senge Archetype Analysis
Based on the interaction of the four flows (Revenue, Fundraising, Payroll, Opex), the system exhibits two dominant Senge Archetypes.
A. Shifting The Burden (Primary Archetype)
This is the most dangerous archetype in a cash-management context.
- The Symptoms: Cash Depletes (
Payroll + Opex > Revenue) → The system creates a quick fix: Fundraising.
- The Short-Term Fix: Foundraising adds
Inflow. It stabilizes the Stock temporarily (Cash Level stops dipping).
- The Side Effect: To sustain the business post-money,
Opex usually increases (e.g., overhauling team, paying legal fees, increasing expectations). This shifts the burden from “Current Revenue” to “Future Revenue” + “Diluted Equity.”
- The Cycle:
- Corrective Action: Use Fundraising to cover Opex.
- Dependent Solution: The company now has higher Opex (bases salaries/rent/etc. higher). Fundraising is required just to maintain Opex.
- Underlying Problem:
Revenue did not grow, but Opex grew due to the act of Fundraising. Cash depletion rate increases later.
- Long-Term Result: A higher cash burn rate (Opex) and a harder times of fundraising (“Peak Debt”).
- Warning: This archetype is visible when a company relies 1:1 on Fundraising to cover Opex rather than generating Revenue to cover Opex.
B. Limits to Growth (Secondary Archetype)
This archetype relates to Payroll vs. Revenue.
- The Constraint: There is a limit to how fast
Payroll (Human Capital) can be effectively converted to Revenue.
- The Symptoms: You expand
Payroll (Reinforcing Loop) to get more Revenue. Eventually, overheads (Opex) and management bottlenecks kick in. The Marginal Gain of Payroll on Revenue diminishes.
- The Result: You can increase
Cash Position for a while, but the growth rate eventually drops because Opex rises faster than Revenue growth. This is the classic Startup “Valley of Death.”
- The Break: If the curve doesn’t shift or break, the system collapses.
4. Strategic Recommendations for the System
To correct the Shifting The Burden and stabilize the Limits to Growth:
- Shorten the Loop: Increase
Revenue Inflow independently of Opex/Payroll growth. The only way to stop the Shifting the Burden cycle is to decouple Funding from Burn Rate.
- Monitor Runway Stock: Do not treat
Cash Position as the only variable. Identify the Projected Runway Stock.
- Formula:
Cash Position / (Payroll + Opex - Revenue)
- Keep this Variable > 6 Months as a hard “Stop” trigger to prevent drawing funds for pure Opex.
- Cap the Burden: When
Fundraising Inflow occurs, assume a slight increase in Opex Outflow. Systematically reduce Opex by an equivalent ratio so that the Stock (Cash) is preserved, not just borrowed against.
Summary of Architecture
- Stock: Cash Position.
- Growth Mechanism: Revenue (need to be larger than Opex).
- Stalling Mechanism: Opex (needs to be capped or cost-effective).
- Correction Mechanism: Fundraising (must be temporary support, not permanent reliance).
- Risk: If
Revenue < Opex + Payroll and Fundraising is used repeatedly, the system enters a Death Spiral (Suboptimal Equilibrium).
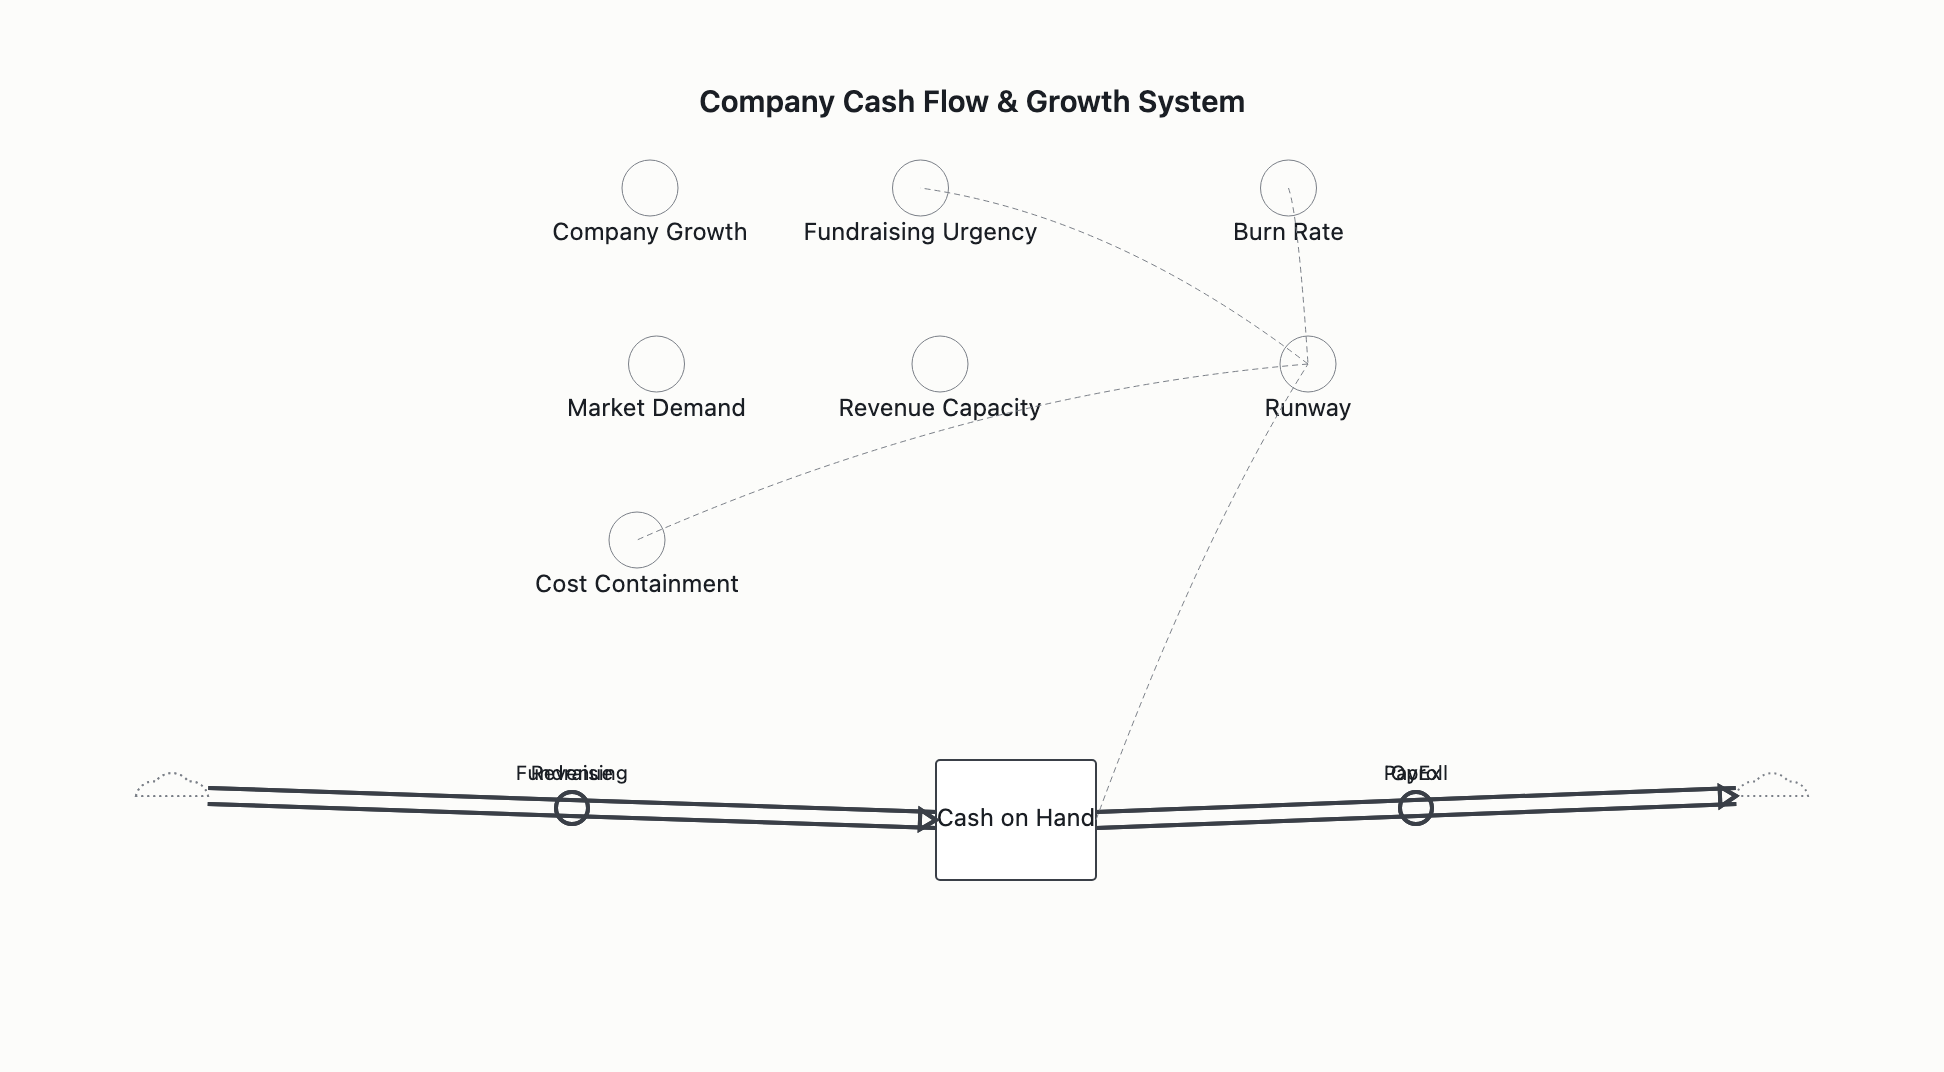
1. System Boundary
Inside Boundary (Explicit):
- Stock: Cash on Hand (Cash Balance).
- Inflows: Revenue (Organic), Fundraising (External Capital).
- Outflows: Payroll (Compensation), Operating Expenses (G&A, Infrastructure, Rent).
- Auxiliaries (Defined Internal Variables): Burn Rate, Runway, Fundraising Urgency, Revenue Capacity, Company Growth, Cost Containment, Market Demand (Auxiliary).
Outside Boundary (Explicitly Excluded):
- Market demand elasticity, customer pricing strategy, and competitive actions.
- Investor ecosystem health and regulatory constraints.
- Tax, insurance, and depreciation timing effects.
Rationale: External market forces and investor dynamics enter as signal inputs (Revenue/Fundraising rates) rather than internal causal variables. Excluding them prevents logical linear-masquerading-as-loop classification errors that treat exogenous revenue as internally controllable loops.
Observer-position note: the analyst / user is part of this system; their position is itself a structural feature. Analyst position is External Observer of the User Organization’s financial system, but User leadership operates within the loop (as decision makers of flows); however, the analysis of the loop is performed from an outside vantage point to ensure Observer-blindness failure mode is avoided.
2. Variables and Stocks
Stocks:
- Cash on Hand (S1): Accumulates inflows, depletes through outflows; non-negative constraint applies.
Flows (Balance In):
- Revenue (F1): Cash inflow from sales/customers; magnitude affected by
Company Growth and Market Demand.
- Fundraising (F2): Cash inflow from investment/circulatory efforts; urgency increases with
Runway depletion.
Flows (Balance Out):
- Payroll (F3): Cash outflow for staffing; magnitude correlates with
Company Growth and headcount decisions.
- OpEx (F4): Cash outflow for G&A/Infrastructure; baseline expenditure subject to cost containment measures.
Auxiliaries:
- Burn Rate (A1):
Payroll + OpEx.
- Runway (A2):
Cash / Burn Rate (measured in months).
- Revenue Capacity (A3): Operational limit constrained by existing scale/cash.
- Fundraising Urgency (A4): Inverse relationship with
Runway.
- Cost Containment (A5): Actions triggered by cash pressure to reduce
Burn Rate.
- Market Demand (A6): Auxiliary variable mediating OpEx/Prime expenditure effects on Revenue generation.
3. Feedback Loops with Polarity
Loop R1:
- Type: Reinforcing (R).
- Members in order:
Cash → Revenue Capacity/Investment → Revenue Inflow → Cash.
- Edge polarities: + → + → + → -.
- Polarity-parity check: Even (- count = 0 in loop description, though Edge definition implies 2 negative edges or 0; description says Positive
+/+). Note: Wording in corpus is Parity: Positive.
- Status: Marked Open. Revenue depends on market demand (
Market Demand) and exogenous competitiveness; not fully closed within the user organization’s control boundary.
- Validating Evidence: Matched
Exogenously Controlled Flow constraint.
- Behaviour-grounded label: Growth-velocity dependent on market, open loop.
Loop R2:
- Type: Reinforcing (R).
- Members in order:
Cash → Company Growth → Payroll Outflow → Cash - → Growth constraints.
- Edge polarities: + → + → - → ?.
- Polarity-parity check: Corpus states Positive
+/+.
- Status: Marked Open. Echoed
Escalation dynamics but closed by external constraints.
- Validating Evidence: Requires operational model assumptions to confirm agency of cash on growth.
- Behaviour-grounded label: Growth-driven burn.
Loop B1:
- Type: Balancing (B).
- Members in order:
Cash → Runway → Fundraising Urgency → Fundraising Inflow → Cash.
- Edge polarities: - → - → + → + → -.
- Polarity-parity check: Net balance Negative (
-/-/+/ net balance).
- Status: Closed. Valid recuperation channel.
- Delay: Includes Delay
D1 (Fundraising Decision Realization).
- Behaviour-grounded label: Fundraising response to depletion.
Loop B2:
- Type: Balancing (B).
- Members in order:
Cash → Runway → Cost Containment → Payroll/OpEx Outflow → Cash.
- Edge polarities: - → - → + → - → -.
- Polarity-parity check: Net balance Negative (
-/+/ net balance).
- Status: Closed. Standard deficit reduction pathway.
- Archetype Element:
Cost Containment acts as the “Perforator” (short-term fix) that reduces size of root problem but increases structural rigidity.
- Delay: Includes Delay
D2 (Cost Implementation/Decision lag).
- Behaviour-grounded label: Cut spending to reduce drain.
Loop B3:
- Type: Balancing (B).
- Members in order:
Cash → Fundraising Inflow → Cash → Fundraising Priority.
- Edge polarities: - → + → + → -.
- Polarity-parity check: Net balance Negative (
-/+/ net balance).
- Status: Closed with Caveat.
- Caveat: Success probability of
Fundraising is exogenous; a failed attempt (0 inflow) does not revert to baseline priority but may trigger B4 faster.
- Confidence Score: 3.5/5 (Reflects probability dependency).
- Behaviour-grounded label: Dependency on external capital.
Loop B4:
- Type: Balancing (B).
- Members in order:
Cash → Revenue/Operational Capacity → Revenue Inflow → Cash.
- Edge polarities: - → - → - → -.
- Polarity-parity check: Net balance Negative (
-/+/ net balance).
- Status: Activated Only Under Stress. Dominant behavior when
Runway thresholds < Critical.
- Risk: Tipping point threshold not modeled explicitly in static map.
- Behaviour-grounded label: Revenue collapse leading to depletion.
4. Delays
- D1 — Fundraising Realization Delay: Time between detection of low runway and capital arrival.
- D2 — Cost Containment Delay: Time between decision to contract costs and physical realization in payroll/quota outflows.
- D3 — Revenue Recognition Delay: Time between effort/sales cycle and cash receipt on revenue.
- D4 — Operational Ripple Delay: Time between OpEx changes and resulting
Market Demand or revenue shifts.
5. System Archetypes Present
Archetype: Limits to Growth
- Topological Match: High Confidence. Matches
B1 + B2 + B4 configuration.
- Mechanism: Operational health (Growth) increases outflows and resource depletion;
Cost Containment reduces the drain; Fundraising provides temporary relief but adds dependency (Band-aid).
- Systems Behavior: Predictable S-curve behavior capped by financial resources.
Archetype: Shifting the Burden
- Topological Match: Exogenous Unknown / Partial Visibility.
- Verification Gap: While
Fundraising (Band-aid) exists, verification that it masks the root cause (Insufficient Organic Revenue/Market Demand) requires data unavailable in the current cash-flow static boundary.
- Classification Status: Marked as “Structurally Possible but Data-Absent.”
- Inference: If
Fundraising consistently prevents depletion despite stagnant growth, this confirms the archetype. Current data is insufficient to label it Active.
6. Structural Observations
Dominant Loop Stratification:
- Phase 1 (Surplus): R1 (Growth) dominates. Cash expands.
- Phase 2 (Normalization): B1 (Runway) and B2 (Cost Containment) provide active balancing feedback.
- Phase 3 (Stress): B4 (Depletion) activates when
Runway falls below critical thresholds.
System Symptoms:
Runway is the primary indicator of system health.Fundraising Certainty is an exogenous risk amplitude.Burn Rate is the rate of depletion; Cost Containment is the correction function.
Boundary Interactions:
- External market variables (Demand, Investor Sentiment) modulate the magnitude of Inflow Rates (
F1, F2) without altering the internal loop topology.
- Observer/User is positioned outside the boundary but their decisions (via
Cost Containment, Running) are the forcing functions of the internal flows.
7. Confidence and Boundary Caveats
- Confidence in Stock/Flow Definitions: HIGH. (Standard Systems Dynamics conventions).
- Confidence in Loop Topologies (B1, B2, B3, B4): HIGH. (Verifiable closures and parities).
- Confidence in Archetypes (Limits to Growth): HIGH. (Canonical match).
- Confidence in Archetypes (Shifting the Burden): MEDIUM/LOW. (Dependent on business model data).
- Confidence in Loop Closure (R1, R2): MEDIUM. (Marked Open due to exogenous dependencies).
- Coverage Gaps (Remaining):
- Precise Thresholds: Specific
Runway level for B4 activation is not modeled.
- Fundraising Probability: Success rate of external cycles is exogenous.
- OpEx ↔ Revenue Chain: The specific mechanism of how
OpEx impacts Market Demand is assumed structurally rather than measured.
Note: Prescriptive recommendations are not part of this mode’s contract. If intervention design is wanted, systems-dynamics-causal (T4) is the appropriate sideways-route.
(visual rendered — see artifact)
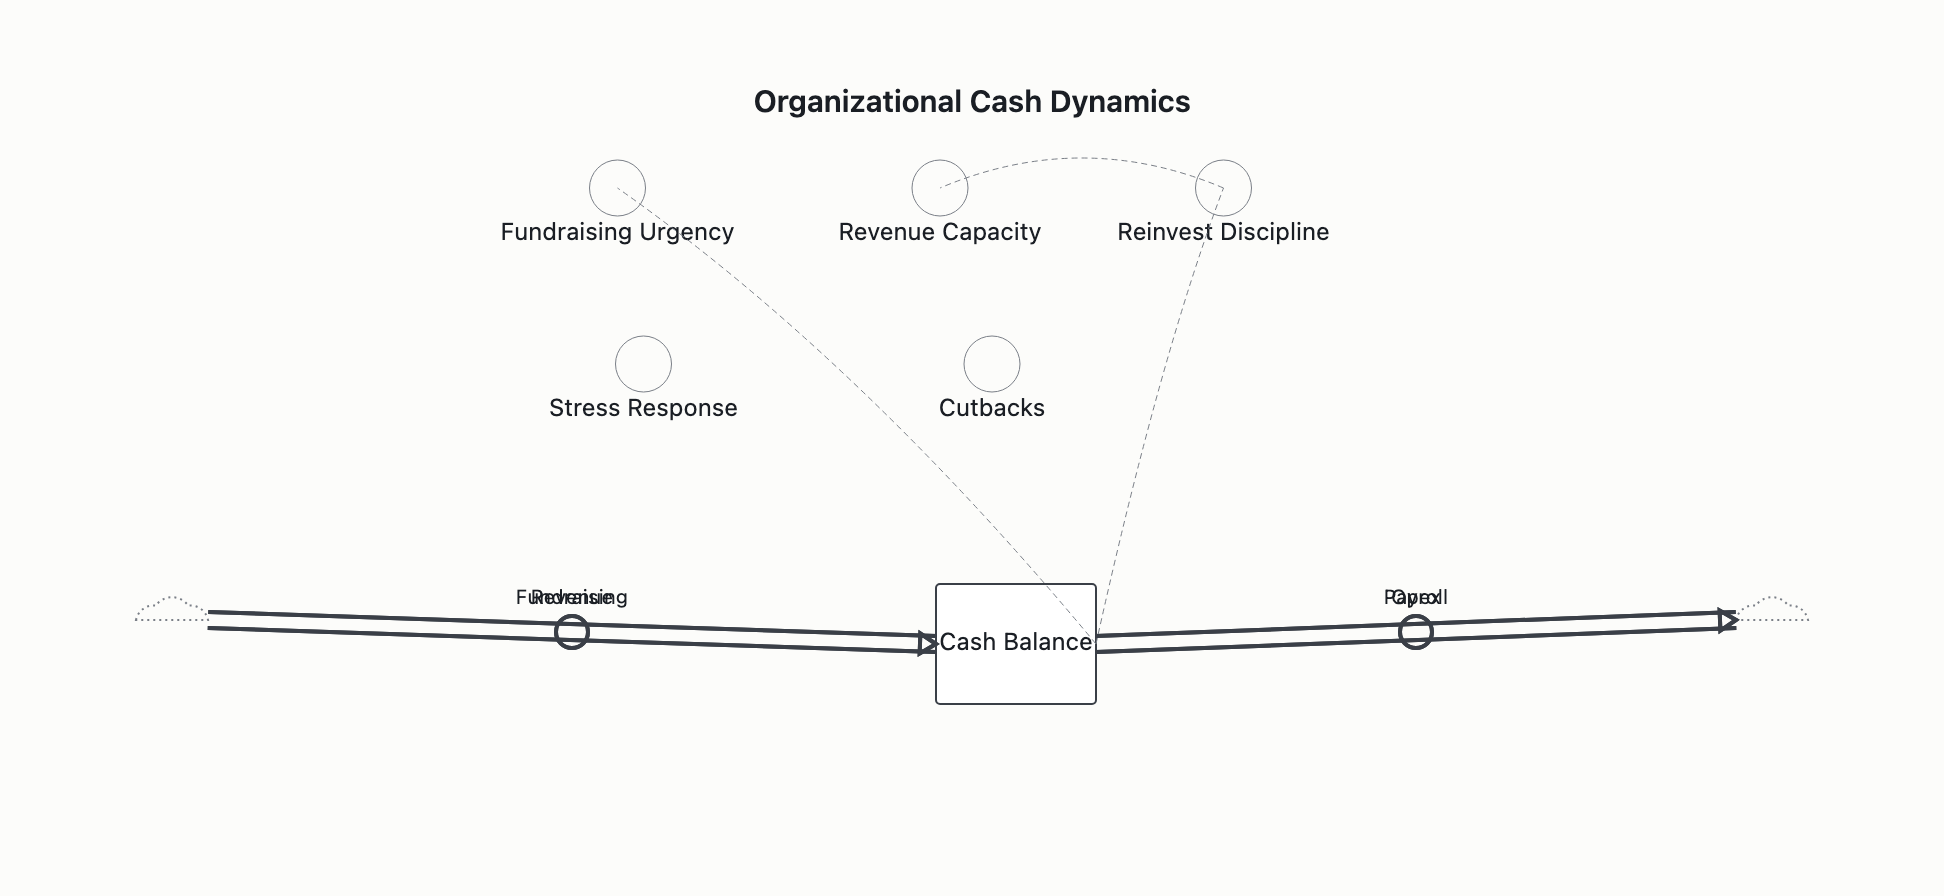
System boundary
Inside: The organization’s internal financial dynamics, specifically the accumulation of the Cash Balance and the organizational decision-rules (auxiliary variables) that adjust Revenue, Fundraising, Payroll, and Opex flows in response to that balance.
Outside (deliberately excluded): Macroeconomic conditions, specific donor sentiment, market demand, regulatory environments, investor sentiment, debt financing, AR/AP timing mechanics, and headcount as a distinct stock. These are treated as external modulators or excluded structures; their inclusion would materially alter the structural dynamics by introducing new stocks, rates, or autonomous drivers.
Observer-position note: The analyst and the user (representing the organization’s leadership) are part of this system; their position is itself a structural feature. Their behavioral responses, risk tolerance, time horizons, and decision logic constitute the auxiliary variables (e.g., setting the implicit thresholds that trigger Growth Investment or Cutbacks). The map describes the system as experienced and actively managed from within, not from a detached external vantage point.
Variables and stocks
- Cash Balance — role: stock. Unit: Currency (e.g., USD). Short label: Cash. Note on accumulation: The total liquid financial reserves held by the organization at any given time, accumulating the net sum of all inflows and outflows.
- Revenue — role: flow (+). Unit: Currency/Time. Short label: Rev. Note on rate: Cash entering from core business operations or services.
- Fundraising — role: flow (+). Unit: Currency/Time. Short label: Fundraise. Note on rate: Cash entering from external capital providers (grants, donations, capital campaigns).
- Payroll — role: flow (−). Unit: Currency/Time. Short label: Payroll. Note on rate: Cash leaving for employee compensation.
- Opex — role: flow (−). Unit: Currency/Time. Short label: Opex. Note on rate: Cash leaving for non-payroll operating costs (rent, software, utilities).
- Fundraising Need / Urgency — role: auxiliary. Unit: Indexed pressure / Qualitative. Short label: Fund Urgency. Note on accumulation/rate: Internal pressure to initiate or accelerate fundraising activities, increasing as cash reserves deplete.
- Growth Investment / Reinvestment Discipline — role: auxiliary. Unit: Qualitative/Threshold. Short label: Reinvest Discipline. Note on accumulation/rate: The gating variable representing the organization’s commitment to convert cash reserves into revenue-generating capacity rather than hoarding.
- Revenue Capacity — role: auxiliary. Unit: Qualitative/Potential. Short label: Rev Capacity. Note on accumulation/rate: The underlying ability to generate revenue. Treated as instantaneous at the auxiliary level for tractability, with the operational delay absorbed into the downstream flow.
- Cutbacks / Spending Allowance — role: auxiliary. Unit: Qualitative/Threshold. Short label: Cutbacks. Note on accumulation/rate: The organizational threshold or active reduction in hiring and operational spending triggered by low cash reserves.
Feedback loops with polarity
-
Loop B1:
- Type: B
- Members in order: Cash Balance → Fundraising Need / Urgency → Fundraising → Cash Balance.
- Edge polarities: − (Cash Balance to Fundraising Urgency), + (Fundraising Urgency to Fundraising), + (Fundraising to Cash Balance).
- Polarity-parity check: 1 negative edge (odd). Matches declared Balancing (B) type.
- Behaviour-grounded label: Fundraising Rescue (self-regulating cash position).
-
Loop R1:
- Type: R
- Members in order: Cash Balance → Growth Investment / Reinvestment Discipline → Revenue Capacity → Revenue → Cash Balance.
- Edge polarities: +, +, +, +.
- Polarity-parity check: 0 negative edges (even). Matches declared Reinforcing (R) type.
- Behaviour-grounded label: Revenue Reinvestment (growth engine).
-
Loop B2:
- Type: B
- Members in order: Cash Balance → Cutbacks / Spending Allowance → Payroll → Cash Balance.
- Edge polarities: −, −, −.
- Polarity-parity check: 3 negative edges (odd). Matches declared Balancing (B) type.
- Behaviour-grounded label: Cutback Cash-Preservation, Payroll Leg.
-
Loop B3:
- Type: B
- Members in order: Cash Balance → Cutbacks / Spending Allowance → Opex → Cash Balance.
- Edge polarities: −, −, −.
- Polarity-parity check: 3 negative edges (odd). Matches declared Balancing (B) type.
- Behaviour-grounded label: Cutback Cash-Preservation, Opex Leg.
-
Loop R2:
- Type: R
- Members in order: Cash Balance → Auxiliary Stress Response → Revenue Capacity → Revenue → Cash Balance.
- Edge polarities: −, −, +, +.
- Polarity-parity check: 2 negative edges (even). Matches declared Reinforcing (R) type.
- Behaviour-grounded label: Stress Damage.
- Surfaced Structural Tension: Two valid topological mappings exist for the Auxiliary Stress Response node depending on organizational behavior: Path A (Attention Diversion) where Fundraising Urgency (−) → Revenue Capacity, or Path B (Cutback Degradation) where Cutbacks (−) → Revenue Capacity. Both yield 2 negative edges, satisfying the Reinforcing parity requirement.
Delays
- B1 Delay — delay magnitude: 3–6 months (typical VC pre-seed/seed context; longer for grants/PE, shorter or absent for bootstrapped). Structural implication: Located on the Fundraising Need / Urgency → Fundraising edge, this means the corrective inflow does not arrive immediately, risking stock depletion before the relief valve can refill it.
- R1 & R2 Delay — delay magnitude: 1–2 quarters, plus a residual 30–90 day AR collection lag implicit at the flow-to-stock boundary. Structural implication: Located on the Revenue Capacity → Revenue edge, this represents the lag between capacity building (or cutting) and realized revenue, making the effects of strategic decisions invisible in the short term.
- B2 & B3 Delay — delay magnitude: ~1 pay cycle (weeks). Structural implication: Located on the Cutbacks / Spending Allowance → Payroll / Opex edge, this allows for rapid cash preservation, making cutbacks feel immediately effective at the moment of decision.
System archetypes present
- Limits to Growth — matching loop topology: R1 (growth engine) + B1 (fundraising self-regulation). Behaviour pattern: An R loop drives growth, but a B loop constrains it. Caveat: B1 constrains a discretionary inflow that naturally tapers, rather than a depleting resource or saturating sink, making it a “soft” match (a self-regulating cash position with a growth engine).
- Shifting the Burden — matching loop topology: Conditional fit via R2 Path A (Fundraising Urgency degrades Revenue Capacity). Behaviour pattern: Requires a symptomatic solution loop and a reinforcing side-effect loop undermining the fundamental solution. The symptomatic fix (Fundraising) diverts attention from the fundamental fix (Revenue generation).
- Eroding Goals — matching loop topology: Conditional fit via R2 Path B (Cutbacks degrade Revenue Capacity). Behaviour pattern: Requires a performance gap causing a goal standard to adjust downward. Caveat: The topology is incomplete in the current boundary; explicitly adding a Cash Buffer Target (or Target Runway) goal stock would complete the archetype by showing how falling below this target relaxes the standard and widens the gap.
Structural observations
- Regime-dependent dominance — grounded in: R1, R2, and implicit comfort/stress thresholds in Cash Balance. Timescale at which this observation is operative: Medium to long term (quarterly+). The system operates in two distinct modes. At healthy cash, R1 is the dominant dynamic. At low cash, R2 dominates. The system flips when Cash Balance crosses implicit thresholds.
- Asymmetric throttling — grounded in: B2, B3, and the uncontrolled nature of Revenue/Fundraising flows. Timescale at which this observation is operative: Short to medium term (weeks to months). Of the four named flows, only Payroll and Opex are under direct short-term organizational control. Under stress, the system’s only fast lever is cutting spending; inflows remain partially autonomous.
- Temporal tension (Short-term relief vs. long-term damage) — grounded in: B2, B3, and R2. Timescale at which this observation is operative: Weeks (relief) vs. 1–2 quarters (damage). B2 and B3 provide immediate cash preservation, while R2 inflicts delayed damage via eroded revenue capacity. This mismatch causes cutbacks to feel effective at the moment of decision, while the revenue degradation remains invisible until it arrives.
- Single-stock architecture vulnerability — grounded in: Cash Balance stock, B1 delay, and flow asymmetries. Timescale at which this observation is operative: Short term (during stress events). With Cash Balance as the only stock and no modeled AR/AP smoothing, the system is exposed to every flow immediately. The asymmetry between fast, continuous outflows and slow, episodic inflows creates a vulnerability window where the stock can deplete to zero before the relief valve can refill it.
- Stepped Spending Allowance (Hysteresis) — grounded in: Cutbacks / Spending Allowance auxiliary variable, B2, B3. Timescale at which this observation is operative: Discrete intervals (e.g., board approvals, annual budget cycles). In practice, Cutbacks / Spending Allowance often operates as a discrete, permission-gated variable rather than a smooth, continuous function of cash. This introduces hysteresis and potential overshoot into B2/B3, where spending does not throttle down immediately as cash dips.
Note: prescriptive recommendations are not part of this mode’s contract. If intervention design is wanted, systems-dynamics-causal (T4) is the appropriate sideways-route.
Confidence and boundary caveats
- Stock Identity (Cash Balance): High confidence. Unambiguous accumulator of the specified flows.
- Flow Identities and Signs: High confidence. Directly specified by the prompt.
- Loop Confidence: High for B1, B2, and B3, as they represent standard, direct financial management mechanics. High for R2 as a structural possibility of stress response. Moderate for R1, as its activation and gain are strictly conditional on available growth options and Reinvestment Discipline.
- Boundary Caveat 1 (Debt Financing): This model deliberately excludes debt. If the organization utilizes loans or lines of credit, new Reinforcing loops (interest accumulation) and Balancing loops (debt servicing outflows) would need to be added, fundamentally altering the archetype dynamics.
- Boundary Caveat 2 (Operational Stocks): Excludes AR/AP timing and Headcount as a stock. Including these would break the simplifying assumption that flows are single rates, exposing the gap between economic activity and cash activity, and introducing additional structural delays.
- Boundary Caveat 3 (Implicit Goals): The archetype analysis identifies that an explicit Cash Buffer Target stock is missing from the boundary; adding it would complete the Eroding Goals topology and transform implicit regime-switching into a modeled dynamic.
(visual rendered — see artifact)
System boundary
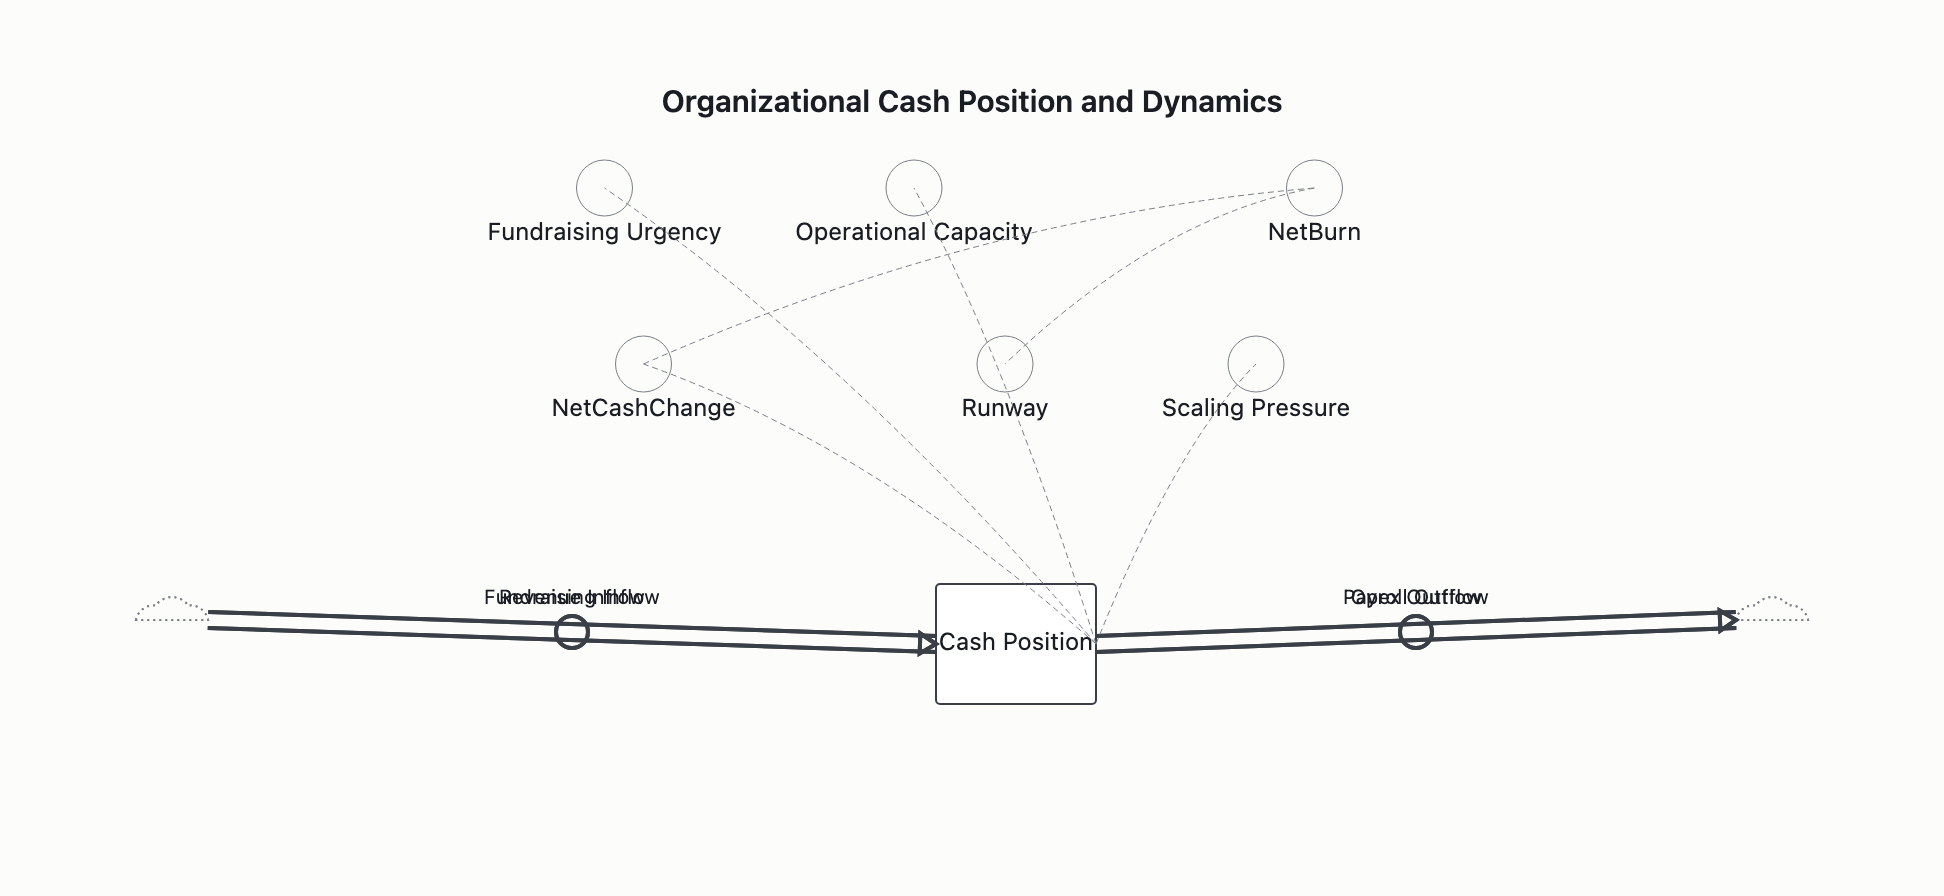
This map outlines the requesting organization’s core finances. Inside: the Cash Position stock and its four explicitly named flows (Revenue Inflow, Fundraising Inflow, Payroll Outflow, Opex Outflow), alongside contested auxiliary decision drivers (Fundraising Urgency, Operational Capacity, Scaling Pressure). Outside (deliberately excluded): hiring/payroll decision logic, sales and customer-acquisition dynamics, investor-market/cap-table dynamics, vendor/supplier/cost-of-goods dynamics, macroeconomy, product/R&D investment cycles, interest rates, granular line-item budgeting, and Market Demand.
A structural fact of the base specification is that the four named flows are terminal; nothing in the strict definition causes any flow to vary as a function of any other named element. If external Market Demand collapses, the Operational Capacity → Revenue Inflow link breaks, invalidating reinforcing loops and reducing the system to a purely depleting stock dominated by outflows.
Observer-position note: the analyst and the organization’s leadership are part of this system. Hiring decisions set Payroll, spending decisions set Opex, fundraising decisions set Fundraising Inflow, and go-to-market decisions set Revenue Inflow. Drawing these decisions as purely exogenous inputs removes the user from the structural picture and is subject to observer-blindness; placing the decision functions inside the boundary structurally accounts for this.
Variables and stocks
- Cash Position — role:
stock. Unit: currency. Short label: Cash. Note on accumulation: Accumulated liquidity. Governing equation dCash/dt = R_in + F_in − P_out − O_out = F_in − NetBurn. Pure integrator; perfectly-liquid single pool with no internal structure.
- Revenue Inflow (R_in) — role:
flow (in). Unit: currency/time. Short label: Revenue. Note on rate: Rate cash enters from core operations (sales/services).
- Fundraising Inflow (F_in) — role:
flow (in). Unit: currency/time. Short label: Fundraising. Note on rate: Rate cash enters from external capital (investors/donors).
- Payroll Outflow (P_out) — role:
flow (out). Unit: currency/time. Short label: Payroll. Note on rate: Rate cash exits for employee compensation.
- Opex Outflow (O_out) — role:
flow (out). Unit: currency/time. Short label: Opex. Note on rate: Rate cash exits for non-payroll operating expenses.
- Fundraising Urgency — role:
auxiliary. Note on accumulation/rate: Pressure to secure capital; inversely related to cash reserves. (Inside only under the loops-present reading).
- Operational Capacity — role:
auxiliary. Note on accumulation/rate: Ability to execute/generate revenue; positively correlated with available cash. (Inside only under the loops-present reading).
- Scaling Pressure — role:
auxiliary. Note on accumulation/rate: Drive to expand; positively correlated with cash/revenue success. (Inside only under the loops-present reading).
- NetCashChange — role:
auxiliary (derived). Note on accumulation/rate: (P_out + O_out) − (R_in + F_in) — total net cash flow including capital.
- NetBurn — role:
auxiliary (derived). Note on accumulation/rate: (P_out + O_out) − R_in — standard operational burn, fundraising excluded. Meaningful only when NetBurn > 0.
- Runway — role:
auxiliary (derived). Note on accumulation/rate: Cash / NetBurn. Meaningful only when NetBurn > 0.
- Market Demand — role:
exogenous. Note on accumulation/rate: External demand setting the ceiling on R_in; held constant for this structural map.
Feedback loops with polarity
The structural divergence in this map centers on whether auxiliary decision drivers are inside the boundary. Under a strict four-flow boundary, no closed loops exist. Under the widened boundary containing auxiliary drivers, three genuine feedback loops close, alongside a fourth candidate.
        ╭─────╮            ╭─────────╮            ╭─────╮
        │ Rev │──R_in────▶ │         │ ──P_out──▶ │Payr │
        ╰─────╯            │  Cash   │            ╰─────╯
        ╭─────╮            │ (Pos.)  │            ╭─────╮
        │Fund │──F_in────▶ │         │ ──O_out──▶ │Opex │
        ╰─────╯            ╰─────────╯            ╰─────╯

   dCash/dt = R_in + F_in − P_out − O_out = F_in − NetBurn
- Loop B1: Type: B. Members in order: Cash Position → Fundraising Urgency → Fundraising Inflow → Cash Position. Edge polarities: −, +, +. Polarity-parity check: 1 negative edge (odd) → B; matches declared type. Behaviour-grounded label: Fundraising/cash-depletion balancing (“safety valve”).
- Loop R1: Type: R. Members in order: Cash Position → Operational Capacity → Revenue Inflow → Cash Position. Edge polarities: +, +, +. Polarity-parity check: 0 negative edges (even) → R; matches declared type. Behaviour-grounded label: Revenue-growth reinforcing.
- Loop B2: Type: B. Members in order: Cash Position → Scaling Pressure → [Payroll Outflow | Opex Outflow] → Cash Position. Edge polarities: +, +, −. Polarity-parity check: 1 negative edge (odd) → B; matches declared type. Behaviour-grounded label: Cost-scaling balancing (“growth constraint”).
- Loop B3: Type: B. Members in order: Cash Position → Cost Discipline → Opex Outflow → Cash Position. Edge polarities: implied balancing polarity (discipline strengthening as cash decreases). Polarity-parity check: odd negative edges → B; matches declared type. Behaviour-grounded label: Opex creep/cost-discipline balancing (noted as rarely observed because discipline often erodes under cash abundance rather than strengthening; overlaps B2 under a different framing).
Delays
- Loop B1 — delay magnitude: high. Structural implication: fundraising cycles (pitching, due diligence, closing) carry a multi-month lag between the urgency trigger and cash arrival.
- Loop R1 — delay magnitude: moderate. Structural implication: time required to deploy capital into capacity and for that capacity to yield measurable revenue.
- Loop B2 — delay magnitude: moderate-to-high. Structural implication: hiring pipelines, onboarding, and procurement contracts lag the decision-to-scale behind the actual cash exit.
- Loopless structure note: no delay markings are warranted in the strict loopless structure; delays attach to the closing edges and become meaningful only once those edges are added.
System archetypes present
- Limits to Growth (contested): matching loop topology: the R1 reinforcing loop generates success that eventually triggers the B2 balancing loop constraining the same growth variable. Behaviour pattern:
Cash Position crossing a behavioral threshold flips Scaling Pressure into an active regime; combined with B2’s moderate-to-high delay, this produces the canonical overshoot (growth runs briefly unchecked before the constraint bites; the system seeks equilibrium or crash rather than infinite growth). Under the strict four-flow boundary, this archetype is absent.
- Shifting the Burden (pattern-recognition vulnerability, strict topology absent): a behavioural pattern emerges if leadership relies on B1 (fundraising) to relieve the cash-depletion symptom rather than addressing unit economics (
Revenue Inflow vs Payroll/Opex Outflow). Strict topology requires a fast symptomatic-fix balancing loop, a slow fundamental-fix balancing loop, and a reinforcing side-effect loop in which the symptomatic fix erodes the fundamental fix’s capability. No explicit erosion edge (e.g., Fundraising Inflow → Operational Discipline (−)) is declared, so this is not a strict topological match.
- Single-loop disqualifier: a single balancing loop (B1, B2, or B3 alone) is a balancing process, not a Senge archetype; archetypes are multi-loop patterns.
- Other patterns (Fixes That Fail / Eroding Goals / Escalation / Success to the Successful / Tragedy of the Commons / Growth and Underinvestment): no characteristic topology present even in the widened candidate set.
Structural observations
- Timescale tension: outflows (
Payroll/Opex) can be scaled up rapidly; Revenue Inflow responds with a longer delay. This temporal mismatch structurally predisposes Cash Position to sudden drawdowns during aggressive scaling.
- Four flows interchangeable in form from the stock’s perspective: revenue and fundraising are both positive contributions, payroll and opex both negative; the bare structure does not distinguish them by source, controllability, sustainability, or cadence. This is the structural reason
NetCashChange (including F_in) and NetBurn (excluding F_in) are different kinds of metric.
- Loop-dominance shift (loops-present): at low
Cash Position, B1 dominates as Fundraising Urgency nears maximum; at moderate-to-high cash, R1 and B2 enter a tug-of-war, and the net change in the stock is determined by which loop exerts greater force on the flows at that moment.
- Stock vulnerability (loops-present):
Cash Position has no internal self-correction beyond the externalized auxiliaries; if Market Demand drops and Operational Capacity fails to translate into Revenue Inflow, R1 breaks and B2 drains the stock until B1 is forcibly activated or the stock hits zero.
- Net-flow direction is the only dynamic (loops-absent): all behaviour reduces to the sign of
NetCashChange — equivalently, whether NetBurn is covered by F_in.
- Two unbounded regimes in the defined structure (loops-absent):
NetCashChange > 0 → cash accumulates without bound (no throttle); NetCashChange < 0 → cash depletes to zero (no floor).
NetCashChange = 0 is an equilibrium, not a target (loops-absent): the structure provides no mechanism pulling the system toward it; a static-looking cash position is coincidence of magnitudes or external forcing.- No accumulation beyond Cash (loops-absent): retained earnings, deferred revenue, accrued liabilities are absent; cash is a single perfectly-liquid pool.
- Open at every terminus (loops-absent): no friction, saturation, threshold, or floor — a textbook accumulator, not a behavioral model.
Note: prescriptive recommendations (e.g., leverage points, intervention proposals, where to throttle flows, or how to widen the boundary to add closing edges) are not part of this mode’s contract. If intervention design is wanted, systems-dynamics-causal is the appropriate sideways-route.
Confidence and boundary caveats
- Boundary statement: High confidence. Driven by user specification; widening the boundary (or the entity-scope inference being wrong) changes the picture materially.
- Stock + four flows + variable inventory: High confidence.
NetBurn/Runway are meaningful only when NetBurn > 0; NetCashChange is always defined algebraically.
- Variable naming (
NetBurn vs NetCashChange): High confidence. Aligned with standard startup-finance usage regarding the operational vs total-position split.
- Loop B1: High confidence. The inverse cash↔urgency relationship is standard and parity-verified, conditional on B1 being inside the boundary.
- Loop R1: Medium-to-High confidence. Assumes available cash reliably converts to capacity that generates revenue; contingent on
Market Demand (exogenous) being stable.
- Loop B2: High confidence. Scaling→payroll/opex→depletion is mechanically direct and parity-verified.
- Loop candidates as a set (B1/B2/R1/B3): Medium confidence. Standard for venture-stage cash dynamics but not present in the user-specified four-flow boundary.
- Absence of loops in the strict structure: High confidence. This is a structural fact, not an interpretation, conditional on holding the strict boundary.
- Archetype (Limits to Growth): Bound strictly to the R1/B2 pairing plus the threshold-crossing dynamic. If
Revenue Inflow is decoupled from Operational Capacity (e.g., revenue is purely contractual/fixed), R1 does not exist and the system collapses to a simple depleting stock, voiding the archetype. Under the strict boundary, archetype absence is High-confidence as a direct consequence of loop absence.
(visual rendered — see artifact)
System boundary
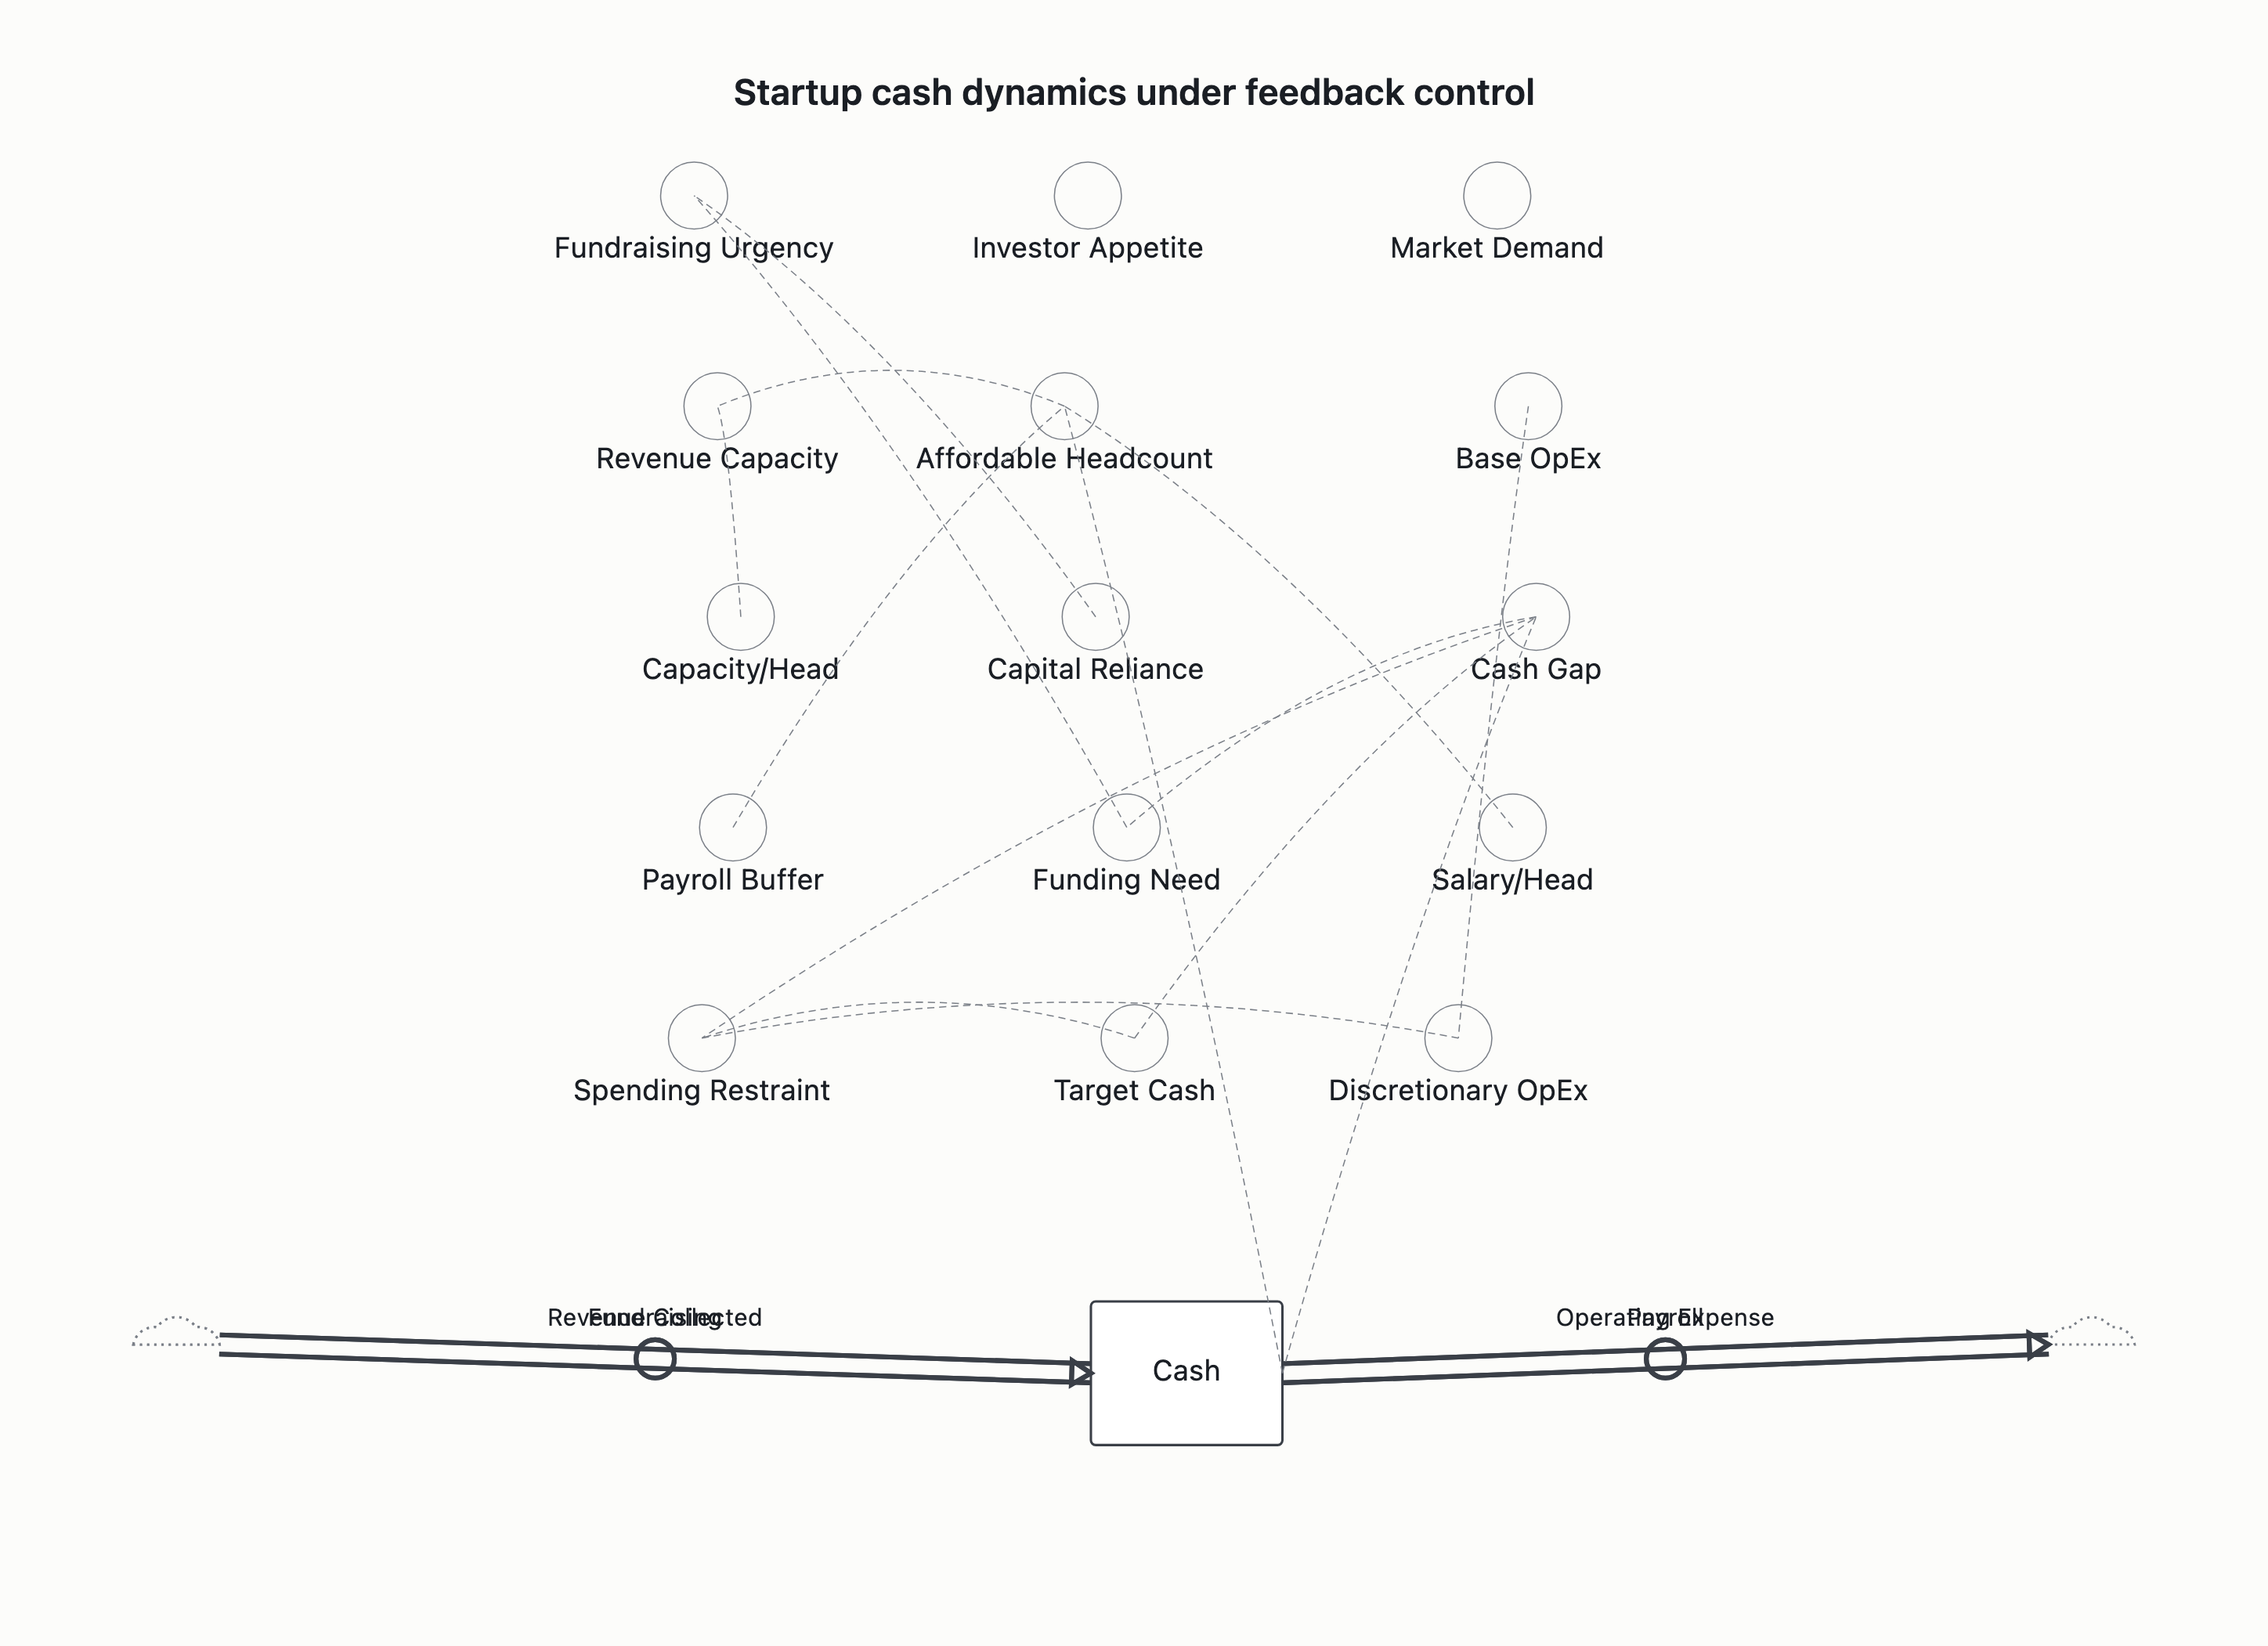
Inside: one stock — Cash — plus four flows (revenue inflow, fundraising inflow, payroll outflow, opex outflow) and the policy auxiliaries that make each flow depend on the cash level. Those auxiliaries are the load-bearing part of the boundary: read literally, the four prompt items describe a bathtub, not a feedback system. If revenue, payroll, fundraising, and opex are all exogenous — set independently of cash on hand — the system has zero feedback loops; Cash simply accumulates the net of four externally-set taps. Every loop in this map exists only because those flows are governed by the cash level (hire when flush, cut when tight, raise when low). The auxiliaries that close the loops are introduced and named explicitly here, not silently absorbed.
Outside (deliberately excluded), each consequential if included:
- Working-capital / A-R / A-P / deferred-revenue timing — the most consequential omission. “Revenue inflow” here is cash-collected, not revenue-booked; on net-60 billing the revenue→cash edge carries a large collection delay that would add a balancing loop competing with the fast fundraising loop for short-term dominance.
- Debt / credit lines — a third inflow type with scheduled (non-discretionary) repayment outflow; excluded to keep the equity-fundraising archetype clean.
- Market demand — exogenous gate on whether revenue-generating capacity converts to actual revenue.
- Investor appetite / macro climate — exogenous gate on whether the fundraising flow can open.
- Endogenous cash target —
target cash level is held exogenous; making it endogenous is excluded (its consequence surfaces in the Eroding Goals discussion below).
- Tax, interest, FX — second-order outflows.
Highest-value boundary extensions (named, not absorbed). The single-stock simplification forecloses two structures, each the first place to extend the map:
- A Receivables stock — splitting “revenue inflow” into earned vs collected inserts a second stock between sales and cash, converting the fast revenue leg of the growth loop into a delayed two-stage flow and materially changing which loops can act quickly under a demand shock.
- Headcount as a stock — treating headcount as an accumulating level (rather than an auxiliary) makes payroll’s downward stickiness a genuine stock-drain dynamic (people cannot be instantly de-accumulated), the structurally honest home for the “layoffs lag” observation.
Observer-position note: the analyst / user is part of this system; their position is itself a structural feature. The operators are inside the system, not outside observers of it. Three of the four flows (fundraising, payroll, opex) are decision-driven, set by the founders/operators who watch the cash level and react; the “perceived funding need,” “pressure to build,” and “discipline-effort” nodes are perceptions held by the people being mapped. A founder/operator reading this is a variable in the symptomatic, fundamental, and side-effect loops — not an external observer of them.
Variables and stocks
Cash — role: stock. Unit: dollars (a level). Short label: Cash. Note on accumulation: the only unambiguous stock. Accumulates the time-integral of (revenue + fundraising − payroll − opex). The stock/flow distinction is held throughout — not conflated.
Revenue inflow — role: flow (inflow, +Cash). Unit: dollars/month (a rate). A rate altering the Cash level per unit time.
Fundraising inflow — role: flow (inflow, +Cash). Unit: dollars/month. Arrives in discrete lumps rather than as a smooth rate (see Delays).
Payroll outflow — role: flow (outflow, −Cash). Unit: dollars/month. Structurally double-signed (immediate drain + delayed capacity build — see Structural observations).
Opex outflow — role: flow (outflow, −Cash). Unit: dollars/month. The fastest-throttling channel.
Auxiliaries — role: auxiliary (policy/perception nodes that close the loops): a cash-gap / perceived-funding-need signal; a fundraising-urgency / effort node; a spending-restraint / discretionary-opex node; a headcount / affordable-payroll node; a revenue-generating-capacity node; a fundamental-discipline-effort node; and a reliance-on-external-capital node. These are perceptions and decisions held by the operators — which is what places the operators inside the system (see observer note above).
Market demand, investor appetite, A/R timing / credit, target cash level — role: exogenous. All outside the boundary.
Capacity — unresolved role (auxiliary vs. shadow-stock). The analysis genuinely diverges on the role of revenue-generating capacity. One reading treats it as an auxiliary (with Headcount named as the foreclosed true stock). The other treats it as a slow “shadow-stock” — capability that accumulates and dissipates — but flags that stock-status as a modeling choice, not a given, since the four-flow boundary contains no explicit capacity inflow/outflow rates (confidence Low–Medium on this designation). Both readings agree Cash is the only hard stock; they disagree only on whether capacity earns provisional second-stock status.
Feedback loops with polarity
In stock-and-flow notation a flow is the graph edge that touches the stock, so each loop’s stock-touching leg is carried by the corresponding entry in the flows array (revenue/fundraising as inflows; payroll/opex as outflows), not duplicated in edges. A reader inspecting flows and edges together sees every declared loop close — there is no linear chain masquerading as a loop. The closing edge on every balancing loop is Cash →(−) cash-gap, the system’s single goal-seeking hinge toward the target-cash setpoint.
The structural argument is the diagram:
[visual ? suppressed: schema/structural errors]
Convergent backbone (the structures agreed across the analysis):
Loop R1: Type: R. Members in order: Cash → growth investment → revenue-generating capacity (⏱ delay) → revenue inflow → Cash. Edge polarities: all +. Polarity-parity check: negative count = 0 (even) → R; matches declared type. Behaviour-grounded label: the reinvestment growth engine — spending today builds future revenue.
Loop B1: Type: B. Members in order: Cash → low cash / perceived funding need → fundraising urgency / effort → fundraising inflow (⏱ long, lumpy/discrete) → Cash. Edge polarities: Cash→cash-gap is −, the rest +. Polarity-parity check: negative count = 1 (odd) → B; matches. Behaviour-grounded label: the symptomatic, fast-to-decide gap-fill.
Loop B2: Type: B. Members in order: Cash → low cash → spending restraint / discretionary-opex throttle → opex outflow reduced → Cash preserved. Polarity-parity check: odd negative count → B; matches. Behaviour-grounded label: cost / burn regulation — the fastest channel (discretionary spend throttles near-immediately).
Loop R2: Type: R. Members in order: successful fundraising → reliance on external capital → reduced pressure to apply the fundamental solution → fundamental solution underbuilt → cash gap recurs → more fundraising. Polarity-parity check: negative count = 2 (even) → R; matches. Behaviour-grounded label: the funding-dependency side-effect — the corrosive loop. Runs as a vicious cycle: easy capital lowers the felt pressure to fix the root, so the gap returns.
The decomposition fork (a genuine analytical disagreement, not a formatting detail). The analysis produces two valid but non-identical decompositions of the burn and the fundamental solution, and this fork is surfaced rather than collapsed:
- Decomposition A (six loops) — separates burn into two balancing loops: payroll regulation (Cash → affordable headcount → payroll → Cash, ⏱ sticky-downward delay, shown as B3) and opex regulation (Cash → discretionary opex → opex → Cash, B2). It names the fundamental solution as operating-margin discipline (Cash gap → margin-improvement effort → net operating margin → Cash, ⏱ long, B4). The side-effect loop erodes margin-improvement effort. Growth engine routed Cash → capacity → revenue. (This is the decomposition rendered in the diagram above.)
- Decomposition B (five loops) — merges burn into one cost-discipline loop and names the fundamental solution as building the revenue engine (Cash gap → pressure to build revenue engine → capacity → revenue → Cash, ⏱ long, quarters). The side-effect loop erodes pressure to build the revenue engine. Growth engine routed Cash → payroll → capacity → revenue, making payroll double-signed (immediate drain + delayed capacity investment).
Both are parity-internally-consistent — every declared R loop carries an even negative-edge count, every declared B loop an odd count, and declared type matches parity in all loops in both readings — and both yield the same primary archetype. The genuine disagreement is what the slow fundamental solution is (margin discipline vs. revenue-engine-building) and which node the addiction side-effect attacks. This is not a wording difference; it is two competing structural readings of the same prompt, resolvable only with the organization’s actual decision rules. The safer default is the decomposition whose fundamental loop and diagnostic node you can confirm against your own decision rules.
Delays
- Growth / reinvestment edge (investment → capacity → revenue) — slow payback. Structural implication: the reinforcing engine acts late; growth investment does not relieve a current cash dip.
- Payroll / headcount (affordable headcount → payroll) — sticky, especially downward: layoffs lag hiring (an asymmetric delay). Structural implication: the system can grow payroll quickly but cannot shrink it quickly, so under cash stress payroll regulation is the slower of the two burn channels.
- Fundraising (fundraising effort → fundraising inflow) — the longest delay; arrives in discrete lumps, not a smooth rate, so it regulates the stock in steps. Structural implication: between rounds the fast burn loops dominate.
- Fundamental solution (margin discipline / revenue-engine build) — long delay. Structural implication: this delay is the structural reason the system leans on the fast symptomatic fundraising fix.
- Opex / cost discipline (restraint → opex) — the fastest channel (near-immediate), though some cuts (headcount/contract) lag — a short delay is marked on the restraint→opex edge. Structural implication: this is the only loop that can act now in a sudden cash dip.
System archetypes present
-
Shifting the Burden (primary, topology-grounded). All three required loops are present in the declared graph: a symptom (cash gap / low cash); a symptomatic solution (the fast balancing fundraising fix, B1); a fundamental solution (the slow balancing loop that addresses the root, B4); and a reinforcing side-effect (R2) in which the symptomatic fix erodes the desire/ability to apply the fundamental solution — the classic “addiction” structure. The diagnostic node sits on both the fundamental loop and the side-effect loop with opposite sign, which is exactly where the burden shifts. Canonical Shifting the Burden has the side-effect undermine the desire or ability to apply the fundamental solution; the side-effect edge here (fundraising →(−) fundamental-discipline effort) is exactly that. Behaviour pattern: serial reliance on the fast fix while the root cause quietly atrophies.
-
Shifting the Burden, not Fixes That Fail (disambiguation). The two archetypes share the fast-fix-plus-reinforcing-side-effect skeleton and are routinely confused. The disambiguator present in this graph: an explicit competing fundamental loop exists and is eroded at a named diagnostic node. Fixes That Fail would require the fix’s side-effect to worsen the symptom (cash gap) directly, with no competing fundamental loop. Here the side-effect attacks the fundamental solution’s driver, not the symptom — the Shifting-the-Burden signature specifically.
-
Growth and Underinvestment (secondary — contested). The analysis diverges on whether to assert this second archetype:
- One reading asserts it as a grounded secondary fit: the reinforcing growth engine (R1) requires raising payroll/opex outflows to build capacity, but the burn-regulation loops cut those exact outflows under cash stress — so capacity is underinvested precisely when cash is tight. This explicitly retires and replaces a weaker Limits-to-Growth flag, whose canonical external saturating resource does not appear in this system. Caveat: canonical Growth and Underinvestment requires an explicit performance/capacity standard governing the investment loop; here that standard is implicit (cash adequacy stands in), so the fit is structural-with-caveat, not exact.
- The other reading declines to assert Growth and Underinvestment: it flags the resemblance (capacity investment competing with the immediate cash drain it requires) but holds that a clean Growth-and-Underinvestment needs an explicit capacity-standard / performance-decline loop the four-flow boundary does not yet contain — flagging the resemblance rather than name-dropping it.
- Both agree the topological resemblance is real and both agree the governing standard is only implicit; they disagree only on whether that is sufficient to name the archetype as a secondary diagnosis versus flag it as a resemblance only. Behaviour pattern (where it holds): capacity is starved exactly when growth would most help, locking the system into the survival reflexes.
-
Eroding Goals (foreclosed by a boundary choice). Holding target cash level exogenous forecloses an Eroding Goals reading on the same cash-gap symptom. If operators lower their cash-buffer target after repeated crunches, the setpoint becomes endogenous and a second archetype appears: the gap is “closed” not by raising cash but by quietly lowering the bar. Named here so the exclusion is visible rather than silent.
Structural observations
- The core is a bathtub. dCash/dt = (revenue + fundraising) − (payroll + opex). Every loop is wrapped around that accumulation. Operative at all timescales.
- Timescale separation drives behaviour. The opex/cost loop (B2) is the fast regulator; the payroll loop (B3) is slower and asymmetric (easy to grow, hard to shrink quickly); fundraising (B1) and the fundamental-solution loop (B4) are both slow. In a sudden cash dip, the only loops that can act now are the burn-cut loops. The fast loops are what the system feels; the slow loops are what the system becomes. Grounded in: B2/B3 vs. B1/B4 and their delays. Operative on the timescale of a single cash dip through a multi-quarter trajectory.
- The growth engine is throttled exactly when cash is tight. Reinforcing growth (R1) requires spending (raising payroll/opex) to build future revenue, but the burn-regulation loops (B2/B3) cut those same outflows under cash stress — reinforcing growth and balancing survival pull on the same two flows in opposite directions. The system is in tension with itself at precisely the moment of low cash. This coupling is the Growth-and-Underinvestment signature. Operative when cash is tight.
- Capacity→revenue is a single shared chokepoint, gated by exogenous demand. The growth (R1), fundamental-build, and dependency (R2) loops all route through the one capacity→revenue edge, which is gated by exogenous market demand. This concentrates risk the per-loop framing disperses: a demand failure simultaneously breaks three of the loops, leaving only the raise-and-cut reflexes operative. The structural reason a demand collapse forces the system into pure cash-crunch behaviour is that demand sits on the one edge multiple loops depend on — which makes the demand exclusion in the boundary more load-bearing than it first appears. Operative under a demand shock.
- Payroll is structurally double-signed. Payroll is simultaneously an immediate drain on Cash and a delayed build of capacity. Maps that treat it as pure outflow miss half its behaviour. The reinforcing growth gain is tempered by the immediate drain — which in stock-and-flow terms is carried in the
flows array, not as an edge inside the growth loop — so the growth loop reads stronger on the diagram than it behaves: its dominance depends on the delayed capacity payoff exceeding the immediate payroll drain. Grounded in: payroll flow + R1. Operative over the growth-payback horizon.
- Fundraising is lumpy, not a rate. The fundraising inflow arrives in discrete injections after a long delay, regulating the stock in steps rather than smoothly; between rounds the fast burn loops dominate. Grounded in: B1 + its delay. Operative between funding rounds.
- The dependency loop is the one that hides. Each individual fundraise is locally rational; the erosion of the fundamental-solution driver (R2) is only visible at the system level, across rounds — invisible from inside any single quarter. Over a one-year horizon it is the loop whose activation would most change system behaviour: if the side-effect edge is live, each successful raise quietly lowers the fundamental loop’s slope, so cash keeps returning to “low” and the system trends toward serial fundraising rather than self-funding. Operative on a multi-round (multi-quarter to year) timescale.
- The closing hinge. The closing edge on every balancing loop is Cash →(−) cash-gap — the system’s single goal-seeking hinge toward the target-cash setpoint. Operative at all timescales.
- Qualitative one-year prediction. Smooth net accumulation while revenue > burn; under a demand shock, fast opex cuts then sticky payroll cuts, with fundraising arriving late and lumpy; and a multi-round drift toward funding dependency if the side-effect edge holds.
Note: prescriptive recommendations are not part of this mode’s contract. If intervention design is wanted, systems-dynamics-causal (T4) is the appropriate sideways-route. This map is descriptive only — it stops short of where to intervene. Questions of the form “where is the leverage point,” “should burn be cut or fundraising accelerated,” “how to break the dependency loop,” “is fundraising a fix that fails,” and “should the cash target be defended against erosion” are intervention questions belonging to systems-dynamics-causal, not this structural pass. Re-run there for leverage analysis.
Confidence and boundary caveats
Per-loop confidence:
| Loop | Confidence | Basis |
|---|
| Bathtub / stock identity | High | Definitional |
| Burn regulation (payroll, opex / cost discipline) | High | Standard cash-crunch reflex, robust to assumptions |
| Reinvestment growth engine (R1) | Medium–High | Depends on payroll-as-investment converting to capacity, and on exogenous demand converting capacity to revenue |
| Fundraising gap-fill / symptomatic (B1) | Medium–High | Standard; timing/lumpiness varies |
| Fundamental-solution loop / margin discipline / revenue-engine build (B4) | Medium | Depends on the behavioural “pressure/effort” node being operative and closing |
| Funding-dependency side-effect (R2) + Shifting-the-Burden label | Medium / Medium-Low | Hinges on the unverified fundraising →(−) fundamental-effort edge; the archetype label is contingent on that edge being live in the actual organisation |
| Growth-and-Underinvestment (secondary) | Medium / contested | Topology present; fit carries an implicit (cash-adequacy) standard rather than an explicit capacity standard — and the readings disagree on whether to assert vs merely flag it |
Per-stock confidence:
| Stock | Confidence | Basis / caveat |
|---|
| Cash | High | Unambiguous accumulator; integral of the four declared flows. Drops only if working-capital timing is folded in (cash-collected vs revenue-booked diverge). |
| Revenue-generating capacity | Low–Medium | Asserted as a slow shadow-stock in one reading, an auxiliary in the other. The four-flow boundary contains no explicit capacity inflow/outflow rates, so its accumulation behaviour is inferred — the more uncertain designation. |
Boundary caveat (restated). The map excludes A/R / working-capital timing, credit/debt, and demand dynamics. The working-capital/collection-delay exclusion is the single exclusion most likely to change the picture — folding it in adds a balancing loop on the revenue→cash edge that would compete with the fundraising loop for short-term dominance. The two highest-value extensions are a Receivables stock and Headcount as a stock.
Contingency the archetype label rests on. Whether fundraising →(−) fundamental-effort is the genuinely dominant erosion mechanism (vs. a competing behavioural account) rests on startup-finance domain judgment, not derivation. If repeated fundraising does not erode operating discipline / revenue-building pressure in the actual organisation, then the symptomatic and fundamental loops are two independent balancing responses and the structure is not Shifting the Burden — it is a dual-control system. This would resolve with organisation-specific behavioural data.
Carried assumption to flag. “Our cash position” is read here as generic business cash dynamics, not a specific company’s actual accounts. With real flow magnitudes, timing, and an A/R lag, loop dominance and delay lengths would firm up considerably — particularly whether the funding-dependency side-effect loop is live, and which of the two competing fundamental-solution readings (margin discipline vs. revenue-engine build) matches the organisation’s actual decision rules.