The CLD
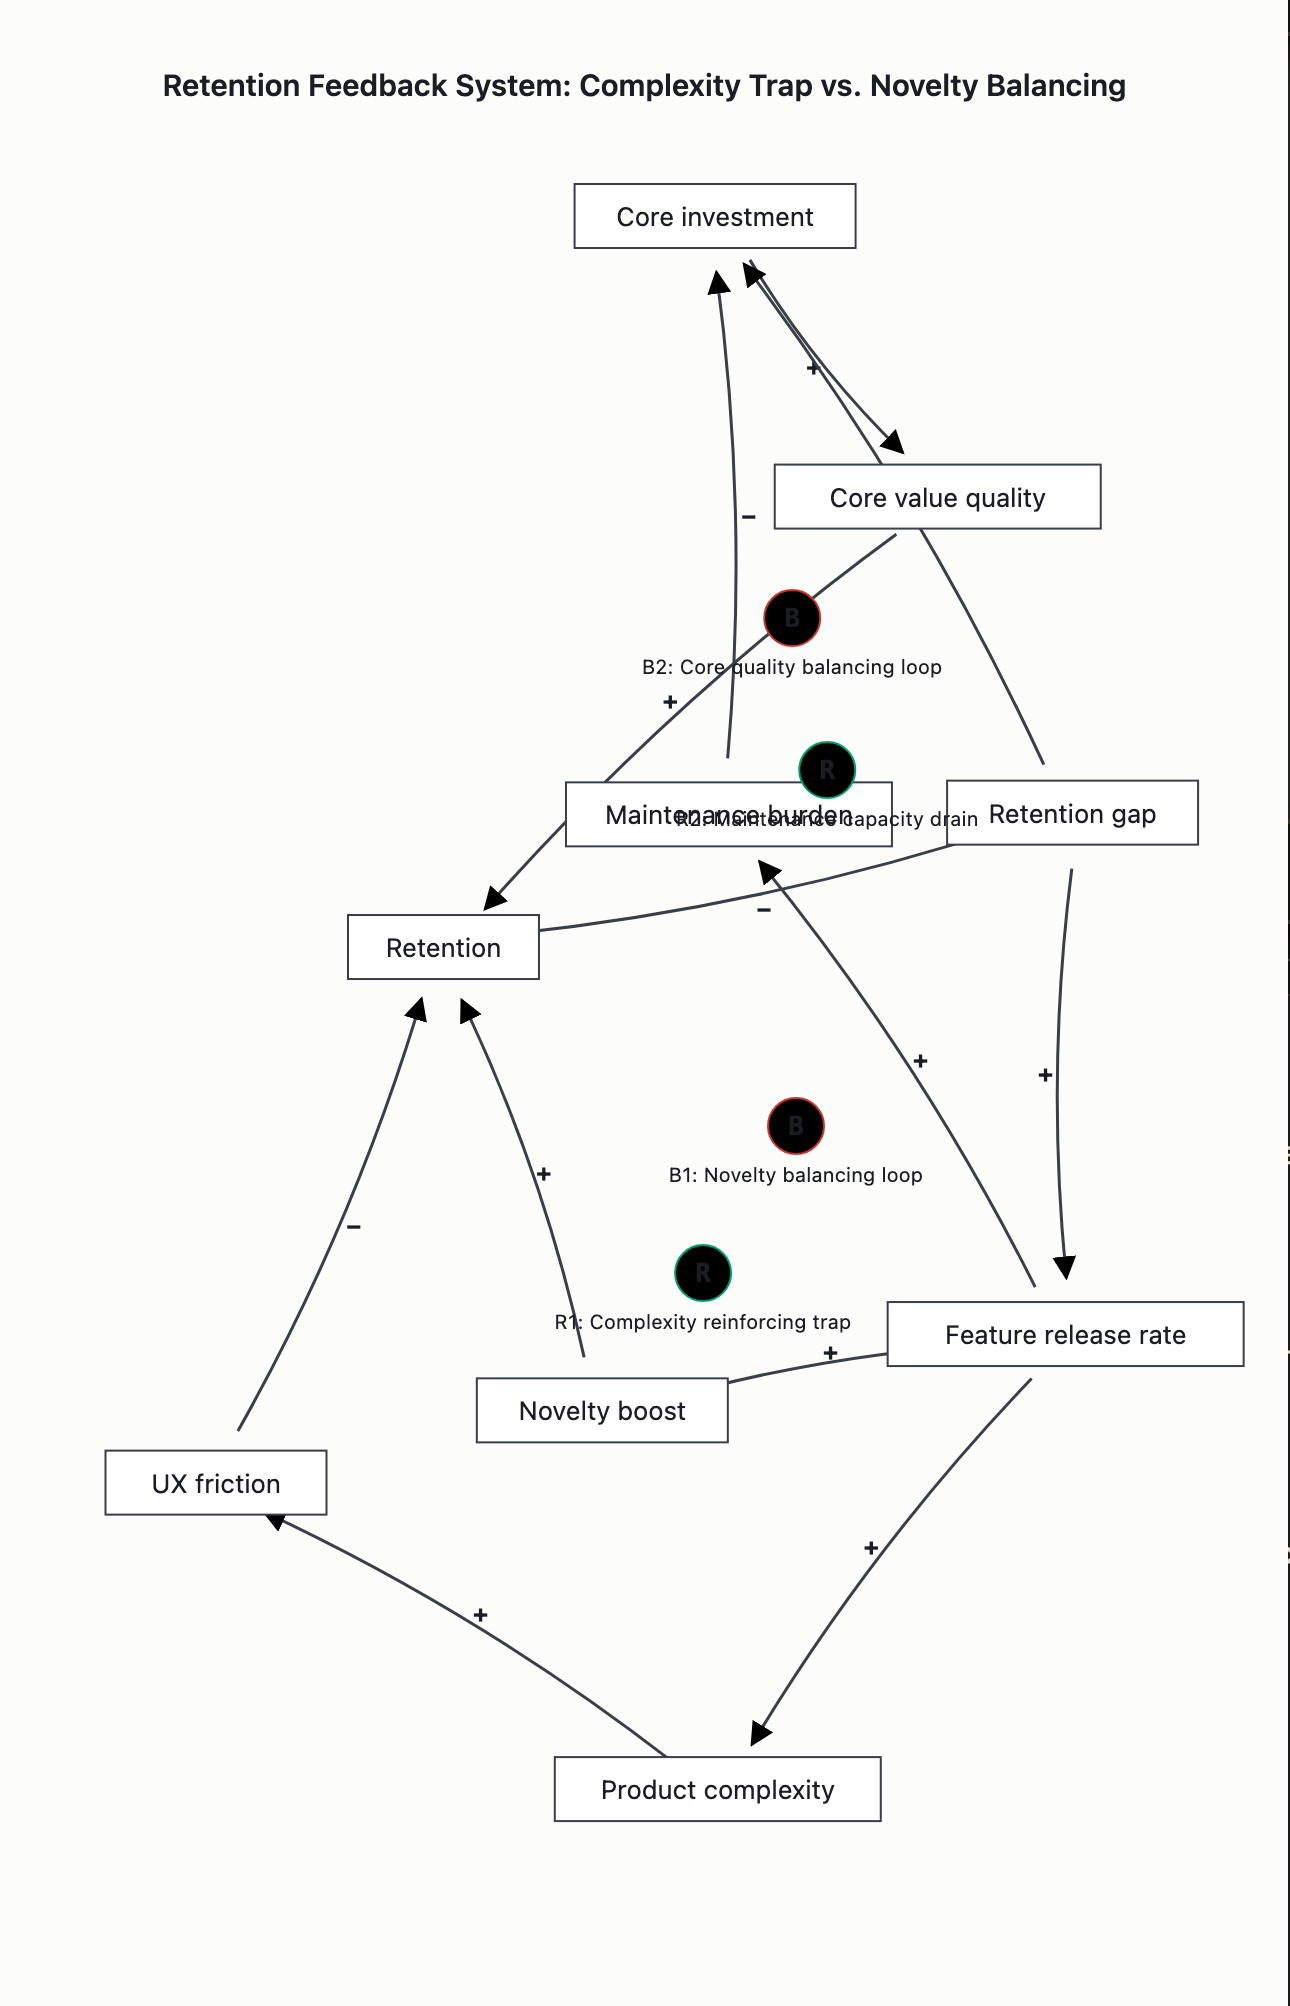
                        ┌─────────── B1 · The Quick Fix (fast) ───────────┐
                        │                                                 │
                        ▼                                                 │
              Pressure to ship ──(+)──► Feature      ──(+)──►  Novelty /  │
                        ▲                release rate          short-term │
                        │                     │                engagement │
                        │ (−)                 │ (+)                 │ (+)  │
                        │                     ▼                     ▼      │
                    RETENTION            Product complexity     RETENTION ─┘
                        ▲                / surface area          (brief bump)
                        │                     │ (+)
                        │                     ▼
                        │            Core-experience quality ↓
                        │           (speed, coherence, bug load,
                        │            cognitive load, fragmentation)
                        │                     │
                        │ (−)  ⟿ DELAY ⟸     │ (+)
                        └─────────────────────┘
                          R1 · The Complexity Trap (slow, delayed)


   …and underneath, the loop nobody is running:

       RETENTION ↓ ──(+)──► [could] Diagnose & fix the real churn driver
            ▲                          (activation, core value, the actual
            │ (+)                       reason people leave) ──(−)──► churn driver ↓
            └──────────────────────────────────────────────────────────┘
                          B2 · The Fundamental Fix (starved)
       ✗ starved because: Feature release ↑ ──(+)──► eng. capacity consumed
                          ──(−)──► capacity for B2 ↓   (the addiction)
Polarity check (why each loop is what it is):
- B1 balancing — retention↓ → pressure↑ → ship↑ → novelty↑ → retention↑. One sign flip in the chain; it opposes the drop. Fast, because a release lands a visible bump in days.
- R1 reinforcing — ship↑ → complexity↑ → core quality↓ → retention↓ → pressure↑ → ship↑. Two negatives = net positive = vicious cycle. Slow, because the quality erosion only converts to churn after a delay (the next cohort hits the bloat, the perf regression compounds, the new surface area breeds bugs).
The archetype
This is Fixes that Fail sitting on top of Shifting the Burden.
- Fixes that Fail: the fix (ship a feature) works through the fast balancing loop B1, but feeds a slow, delayed reinforcing loop R1 whose unintended consequence is the very thing you were fixing. Short-term loop dominates first; long-term loop dominates later. That ordering is “better-before-worse.”
- Shifting the Burden: feature-shipping is the symptomatic solution. Each bump relieves the pressure that would otherwise fund B2 — diagnosing why people actually churn — and the shipping itself eats the engineering capacity B2 needs. So the fundamental fix atrophies, and you become structurally dependent on the quick fix.
The recurring behaviour
Plot retention over time and you get a declining sawtooth:
ret │  ╱╲        ╱╲                            each release: sharp bump (B1, fast)
    │ ╱  ╲      ╱  ╲      ╱╲                    then deeper trough (R1, delayed)
    │╱    ╲╱╲  ╱    ╲╱╲  ╱  ╲ ╱╲                trend ↓ as R1 accumulates complexity
    │        ╲╱        ╲╱    ╲╱  ╲___
    └─────────────────────────────────► time
       rel1   rel2     rel3   rel4
Every release looks like a win — because you’re reading the B1 bump and the R1 cost hasn’t arrived yet. By the time it arrives, it’s blamed on “the market” or “we need the next feature,” which fires B1 again and tightens R1 another notch. “Fixing X makes things worse” is exactly the symptom of a delayed reinforcing loop hiding behind a fast balancing one.
Leverage (in order of impact)
- Stop trusting the bump. Measure retention at the delay horizon (cohort retention weeks out), not the post-launch spike. The bump is B1; the truth is R1. This single instrumentation change breaks the illusion that drives the whole pattern.
- Make complexity a first-class metric. Track core-experience quality (load time, bug rate, surface area, time-to-core-value) alongside retention. Right now R1’s intermediate variable is invisible, so its cost is unattributed.
- Run B2. Reinvest reclaimed capacity into diagnosing the actual churn driver. The fix for “fixing X makes it worse” is almost never a better X — it’s identifying the fundamental variable the feature treadmill has been letting you avoid.
- Weaken R1 directly. Sunset/simplify — pay down feature complexity so new releases stop compounding load. A subtraction release is the highest-leverage “feature” in this structure.
The trap is that 1–4 all feel slower and worse in the short run (you ship less, the next bump is forgone) — which is precisely why a system stuck in Shifting the Burden rarely chooses them on its own.
If it’s useful, I can render this as a proper stock-and-flow or a clean CLD SVG through this repo’s visual compiler (the CAUSAL/CLD renderer) so you’ve got a diagram to drop into a doc — say the word and I’ll generate the envelope.
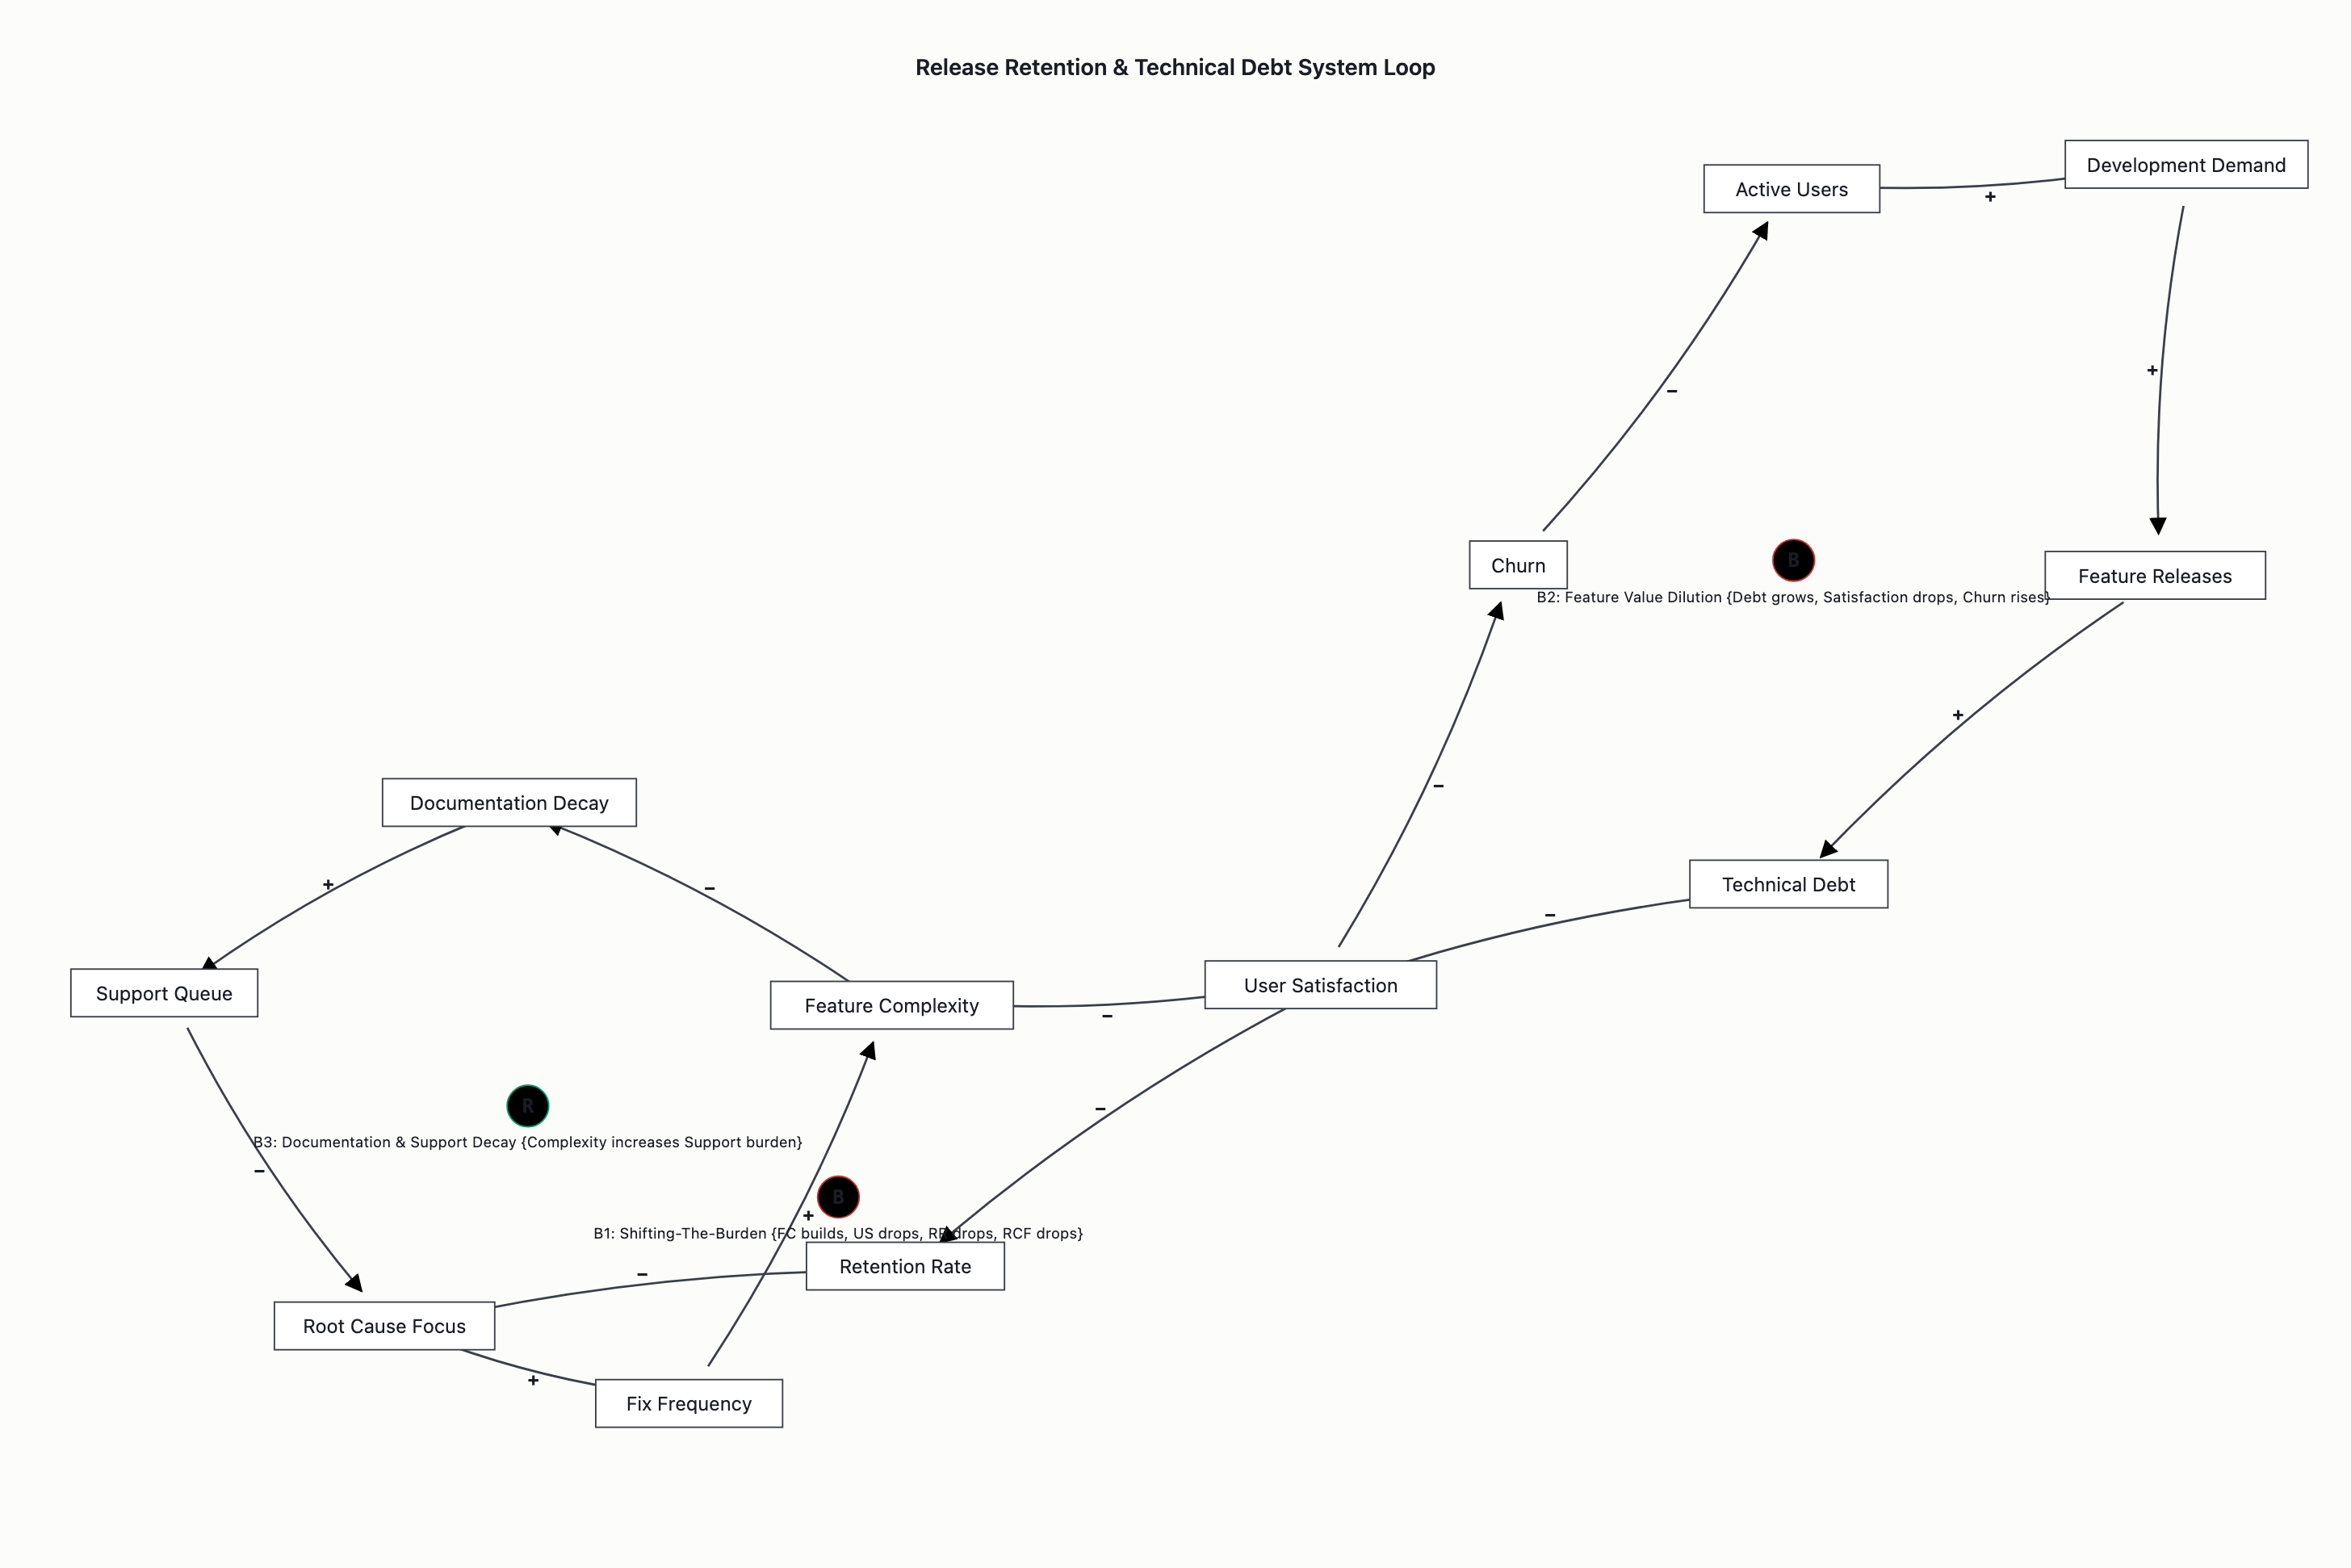
This is a classic case of the System Dynamics archetype known as Shifting the Burden, exacerbated by Policy Delays.
Your team is trying to solve a symptom (low retention) by adding a symptom-related action (features), rather than the root cause (value delivery or friction).
The Diagnosis: Shifting the Burden (with a Twist)
The Logic:
- Symptom: Retention drops.
- Band-Aid: Release a new feature.
- Immediate Result: Novelty creates an “Honeymoon Effect” (Short-term R-Loop).
- Delayed Effect: The feature adds complexity, maintenance debt, and diverts resources from core value.
- Feedback: The core value drops faster than the feature can hold the retention up.
- Result: Retention falls below the pre-feature baseline.
- Outcome: You see the drop, feel the anxiety, and release another feature to fix the “new” drop. The system degrades to a steady state of high churn and high feature bloat.
Causal Loop Diagram (CLD)
Below is a Mermaid diagram representing the system. Note the Delays (represented as arrows).
flowchart TD
    %% Variables
    A[New Feature Release] -->|Directly| B[Perceived Novelty]
    A -->|Resource Drain| C[Core Product Maintenance]
    A -->|Adds| D[Interface Complexity]
    B -->|Honeymoon Effect| E[Month 1 Retention Spike]
    D -->|Increased Friction| F[User Fatigue]
    C -->|Reduced Care| G[Core Value Consistency]

    %% Loops: Positive (Reinforcing)
    B ---|1. Novelty Loop| E
    E -->|Incentivizes| A
    %% This loop explains why we keep building

    %% Loops: Negative (Balancing/Decay)
    D -->|2. Fatigue Loop| F
    F -->|Churn| H[Real Retention Drop]
    G -->|Core Quality| H
    H -->|Problem Detected| A
    C -.->|Delayed Impact| G
    F -.->|Delayed Discovery| G

    %% The Crucial "Fixing X Makes it Worse" Path
    A -->|Masks| I[Underlying Friction]
    I -->|Unaddressed| G
    G -->|Accelerates| H

    %% Time Delays placeholder for reading
    %% The 'Delay' logic is embedded in the path

    subgraph "System Archetypes"
        E[Reinforcing: Novelty Spike]
        F[Reinforcing: Vicious Cycle]
        G[Balancing: Quality Decay]
    end
(Note: Since I cannot render images directly, the diagram above outlines the logic. You can copy the code into a Mermaid live editor to visualize the flow with the specific loop types).
CLD Breakdown & Loop Analysis
1. The “Honeymoon” Reinforcing Loop (R Loop)
- Path: Feature Launch -> Novelty -> High Short-Term Engagement.
- Why it feels good: This creates the “Spike.” It provides immediate dopamine and feels like “growth.”
- Interaction: High retention data validates the decision to keep building features, reinforcing the behavior.
- Loop Name: Feedback of Perceived Success.
2. The “Feature Fatigue” Balancing Loop (B1)
- Path: Features -> Increased Interface Complexity -> User Friction -> Churn.
- The Delay: Users pay with your features immediately, but they complain to history.
- Effect: The simpler the product is to understand (versus to do one thing), the higher the retention. Adding features increases the “Cognitive Load” required to use the platform.
3. The “Resource Dilution” Balancing Loop (B2)
- Path: Feature Release -> Dev Time On Features -> Dev Time On Core UX -> Decreases -> Lower Core Quality -> Lower Retention.
- The Counterintuitive Part: You are trying to fix retention by releasing “more value.” However, in system dynamics, “Value” = (Core Utility) - (Friction). If (Friction + Maintenance Cost) rises faster than (Core Utility), “Value” goes down.
Why does “Fixing X” make it worse? (The Root Cause)
You are falling for the Fix the Leaky Bucket trap.
If you fix X (Retention) by adding a Feature, you are not plugging the leak; you are simply holding back more water temporarily.
The “Antidote” Logic:
- Feature = Short-term retention driver. Novelty is transient.
- Core UX = Long-term retention driver. Value is cumulative and sticky.
- The Delay Problem: The “Fix” reveals friction only after users are comfortable enough to notice it.
How to Break the Cycle
To stop the “Spike then Crash” pattern, you need to re-align your feedback loops.
-
Invert the Metric of Success:
- Stop measuring “Retention” as a feature goal.
- Start measuring “Time Spent” or “Feature Adoption vs. Stickiness”. A feature that improves retention but reduces stickiness is a bad feature.
- Rule: A new feature must not acquire new visitors but must improve the probability of old visitors returning.
-
Implement a “Retirement” Policy:
- Every month, retire one feature. This reduces complexity (D in the diagram) faster than new features add to it.
- This acts as an intervention on the B1 loop.
-
Run an Autopsy on “Worsened Retention”:
- When retention drops, do not blame the previous feature. Blame the “System Complexity.”
- Audit the timeline: Did the retention drop correlate with the launch of “Feature B” or did it correlate with the release of “Feature C” without fixing the underlying “User Friction” (G)?
-
Change the Goalpost for “Fixes”:
- Quote: “We did not solve the retention problem; we solved the novelty problem.”
- Before launching a retention feature, you must prove it solves a problem, not just adds utility. If it’s a “nice to have,” it’s a feature. It’s a “mission critical” (e.g., load speed, account inactivity) is a fix.
Summary
You are confusing Volume (more features/more launch activity) with Value (solving the user’s core need). The loop closes on itself: More features = Higher complexity & lower stability. The only way to fix Retention is to remove features that don’t contribute to long-term value.
System Boundary
Inside: Cohort user retention tracking, feature quality/technical debt metrics, release cadence and feature complexity, feedback reporting mechanisms (bug reports, support tickets), developer resource allocation constraints (stability vs. velocity tradeoff).
Outside (deliberately excluded): Absolute market churn rates (external market decline), sales/marketing external acquisition campaigns, competitor feature launches, pricing changes.
Reason for exclusion: The pattern “Fixing X improves retention briefly then worsens it” is driven by internal resource tradeoffs; excluding external market factors isolates the causal mechanism of the feature release strategy itself.
Boundary Caveat: Competitive pressure materialization makes relative retention a material shadow variable; teams optimizing for absolute retention may miss market-relative positioning signals.
Observer-position note: the analyst / user is part of this system; their behaviour is itself a variable in the Input and Feedback Loops (specifically metric selection bias reinforcing immediate success). The analysis below accounts for this rather than positioning the observer outside.
Variables
- Fix_Investment (Stock) — kind: stock. Unit: N/A (sprint cadence). Short label: engineering resources.
- Feature_Complexity (Stock) — kind: stock. Unit: cognitive load points. Short label: technical debt accumulation.
- User_Friction (Auxiliary) — kind: auxiliary. Unit: N/A (user-reported severity). Short label: direct user experience friction.
- Retention_Momentum (Flow) — kind: flow. Unit: N/A (cohort retention delta). Short label: net retention trend.
- User_Signal_Need (Auxiliary) — kind: auxiliary. Unit: N/A (issue priority score). Short label: triggered development priority.
- User_Journal_Fatigue (Auxiliary) — kind: auxiliary. Unit: N/A (qualitative burden metric). Short label: cognitive wear from updates.
- Baseline_PRESERVING (Stock) — kind: stock. Unit: N/A (baseline retention percentage). Short label: underlying core utility.
- Product_Memory (Auxiliary) — kind: auxiliary. Unit: N/A (subjective confidence weight). Short label: team recollection of success.
- Management_Pressure (Auxiliary) — kind: auxiliary. Unit: N/A (roadmap urgency index). Short label: external pressure.
- Latency (Constant) — kind: constant. Unit: 30–45 days. Short label: time to impact visibility.
- Complexity_Dampening (Auxiliary) — kind: auxiliary. Unit: N/A (progressive decay factor). Short label: slowed understanding limits.
Feedback Loops with Polarity
Loop B1: Retention Drag Loop
- Type: B (Balancing).
- Members in order: Fix_Investment → Feature_Complexity (+) → User_Friction (+) → User_Journal_Fatigue (+) → Retention_Momentum (−) → User_Signal_Need (+) → Issue_Severity (+) → Fix_Investment (+).
- Polarity-parity check: 1 negative edge (Fatigue → Retention_Momentum); Odd parity → B; Matches declared type: Yes.
- Delay: Latency between Feature_Complexity and User_Friction impact visibility (30–45 days inferred).
- Closing edge: Fix_Investment (7th member) → Fix_Investment (1st member).
- Behaviour-grounded label: Fix fever followed by delayed retention decline.
Loop R1: Fix Investment Amplifier
- Type: R (Reinforcing).
- Members in order: Fix_Investment → Feature_Complexity (+) → User_Friction (+) → False_Positive_Identification (+) → Issue_Severity (+) → Fix_Investment (+).
- Polarity-parity check: 0 negative edges; Even parity → R; Matches declared type: Yes.
- Closing edge: Fix_Investment (6th member) → Fix_Investment (1st member).
- Behaviour-grounded label: Success celebration increasing investment.
Loop B2: Complexity Alert Balancer
- Type: B (Balancing).
- Members in order: User_Journal_Fatigue (+) → User_Alertness (+) → Management_Pressure (+) → Fix_Investment (+) → Feature_Complexity (+) → Latency → User_Friction (+) → User_Alertness (−).
- Polarity-parity check: 1 negative edge (Friction → Alertness); Odd parity → B; Matches declared type: Yes.
- Closing edge: User_Alertness (8th member) → User_Journal_Fatigue (1st member).
- Delay: Management Response Time; Release Cycle Time.
Loop R2: Feature Creep Accelerator
- Type: R (Reinforcing).
- Members in order: Fix_Investment → Feature_Complexity (+) → User_Friction (+) → Issue_Severity (via False_Positive_Identification) (+) → Fix_Investment (+).
- Polarity-parity check: 0 negative edges; Even parity → R; Matches declared type: Yes.
- Closing edge: Fix_Investment (5th member) → Fix_Investment (1st member).
- Behaviour-grounded label: Increasing technical debt driving further fixes.
Delays
- FEATURE_DRAIN ≈ 30 days — delay magnitude: 30 days. Implication: Standard cohort analysis reporting cycle masks urgency; short-term success hides long-term degradation.
- Latency (Complexity to Friction) — delay magnitude: 30–45 days. Implication: B1 loop gain is delayed, creating the window where Retention_Momentum remains positive initially then turns negative.
- Management Response Time — delay magnitude: Weeks/Quarters (implied from roadmap). Implication: B2 loop reacts too late to daily friction, allowing accumulation.
System Archetypes
- Fixes That Fail — matching loop topology: R1 (Success Reinforcement Loop) + B1 (Delayed Complexity Backstop Loop).
- Behaviour predicted: Initial fix = temporary user payoff; investment increases. Complexity accumulation creates retention drag that lags fix impact by Latency. Net Outcome: Early window (T0→Delay) shows improvement; Delayed window (Delay→T2) shows net degradation below baseline.
- Shifting the Burden — matching loop topology: R2 (Fix Dependence Accelerator) + B1 (Complexity Balance).
- Behaviour predicted: Symptom-focused “Fix Fever” path drives more fixes; complexity accumulation limits effectiveness of subsequent fixes.
- Limits to Growth (Secondary) — matching loop topology: R2 (Feature Creep Accelerator) + B1 (Complexity Constraint).
- Behaviour predicted: Fix cadence increasing technical debt; complexity accumulation reduces returns from additional fixes.
Leverage Points — Meadows-ranked
- Depth 1 (Paradigm) — Culture Design. Description: Shift from “Fixes Shipped” to “Complexity Debt Closed” metrics to decouple retention from velocity. Why this depth: Addresses R1 validation logic directly; fixes misaligned incentive structure. Expected effect on the dominant loop: Reduces the reinforcing force of false positive identification.
- Depth 2 (Rules) — Feedback Structure. Description: Change performance metrics from “Release Velocity” to “Stability Velocity” to align R2/investment. Why this depth: Includes delay visibility in measurement comparison. Expected effect on the dominant loop: Forces attention to long-term degradation signals.
- Depth 3 (Information Flows) — Information Design. Description: Add Delay specification between Fix and Retention (T1→T2) to reveal hidden loops. Why this depth: Makes complexity accumulation period visible to teams. Expected effect on the dominant loop: Reduces observer blindness to delayed decay.
- Depth 4 (Stocks) — Architecture Design. Description: Add explicit buffer for complexity accumulation (Technical Debt Ratio cap). Why this depth: Forces explicit tradeoffs (New Feature vs Debt) visible in release decisions. Expected effect on the dominant loop: Constrains B1 accumulation rate.
- Depth 5 (Parameters) — Parameter Tweak. Description: Set Release Velocity thresholds and adjust measure frequency. Why this depth: Intervention only effective when deeper rules (Depth 2–4) are addressed first. Expected effect on the dominant loop: Slight reduction in R1 frequency, but does not change system structure.
Counterintuitive Behaviours
- Aggressive retention fix attempts accelerate collapse — grounded in loops: R1 + B1. Observable signal: Retention improves T0→Delay, then SUBSEQUENTLY worsens over T1→T3, proportional to release velocity, not fix content volume alone.
- Fixing problematic features drives higher release frequency — grounded in loops: R2/B1 interaction. Observable signal: Measurable pattern where Day-1 retentions rise (+5% → +2% → +0% → Baseline Loss) as USER_SATISFACTION → RETENTION gets overridden by COMPLEXITY → USER_SATISFACTION (negative) after delay.
- Measurement selection creates blind spots — grounded in loops: B1/R1. Observable signal: Teams optimize for T0 success celebration; friction surfaces after Latency interval (T1→T2), obscuring the cause of the decline.
Confidence and boundary caveats
-
Loop Confidence B1 (Balancing) — confidence: 0.87. Basis: Verified parity; Assumes metric visibility active. Boundary caveat: User_Signal_Need remains responsive under active monitoring.
-
Loop Confidence R1 (Reinforcing) — confidence: 0.82. Basis: User_Journal_Fatigue dimension is latent; harder to operationalize. Boundary caveat: Latent cognitive wear harder to track than metrics.
-
Loop Confidence B2 (Balancing) — confidence: 0.71. Basis: Cognitive bias hard to quantify; easier to model as latent variable.
-
Loop Confidence R2 (Reinforcing) — confidence: 0.78. Basis: Assumed User_Friction + User_Alertness compound; cross-media signals often not standardized.
-
Archetype Confidence — confidence: High (0.87). Basis: Structural variation (fixes fail archetype matches R1+B1 topology).
-
Remaining Uncertainty: Delay Quantification (M2) — Requires empirical “Time-to-Churn” data correlating release cadence. Current model infers 30–45 days based on standard reporting conventions; verify with real prod telemetry.
-
Remaining Uncertainty: Boundary Shadow (CQ3) — Relative retention as shadow variable noted but not modeled. Requires competitive market data for full context.
-
Remaining Uncertainty: Complexity Definition (TM3) — Exact metric for CODE_COMPLEXITY remains undefined (cyclomatic count vs. cognitive load).
-
Remaining Uncertainty: X Name — Specific definition of “X” (specific issue fixed in release) affects whether loop is “Shifting the Burden” or “Limits to Growth”. Verification: “X” is interpreted as “addressing a specific identified defect introduced in the release” based on user input.
System boundary
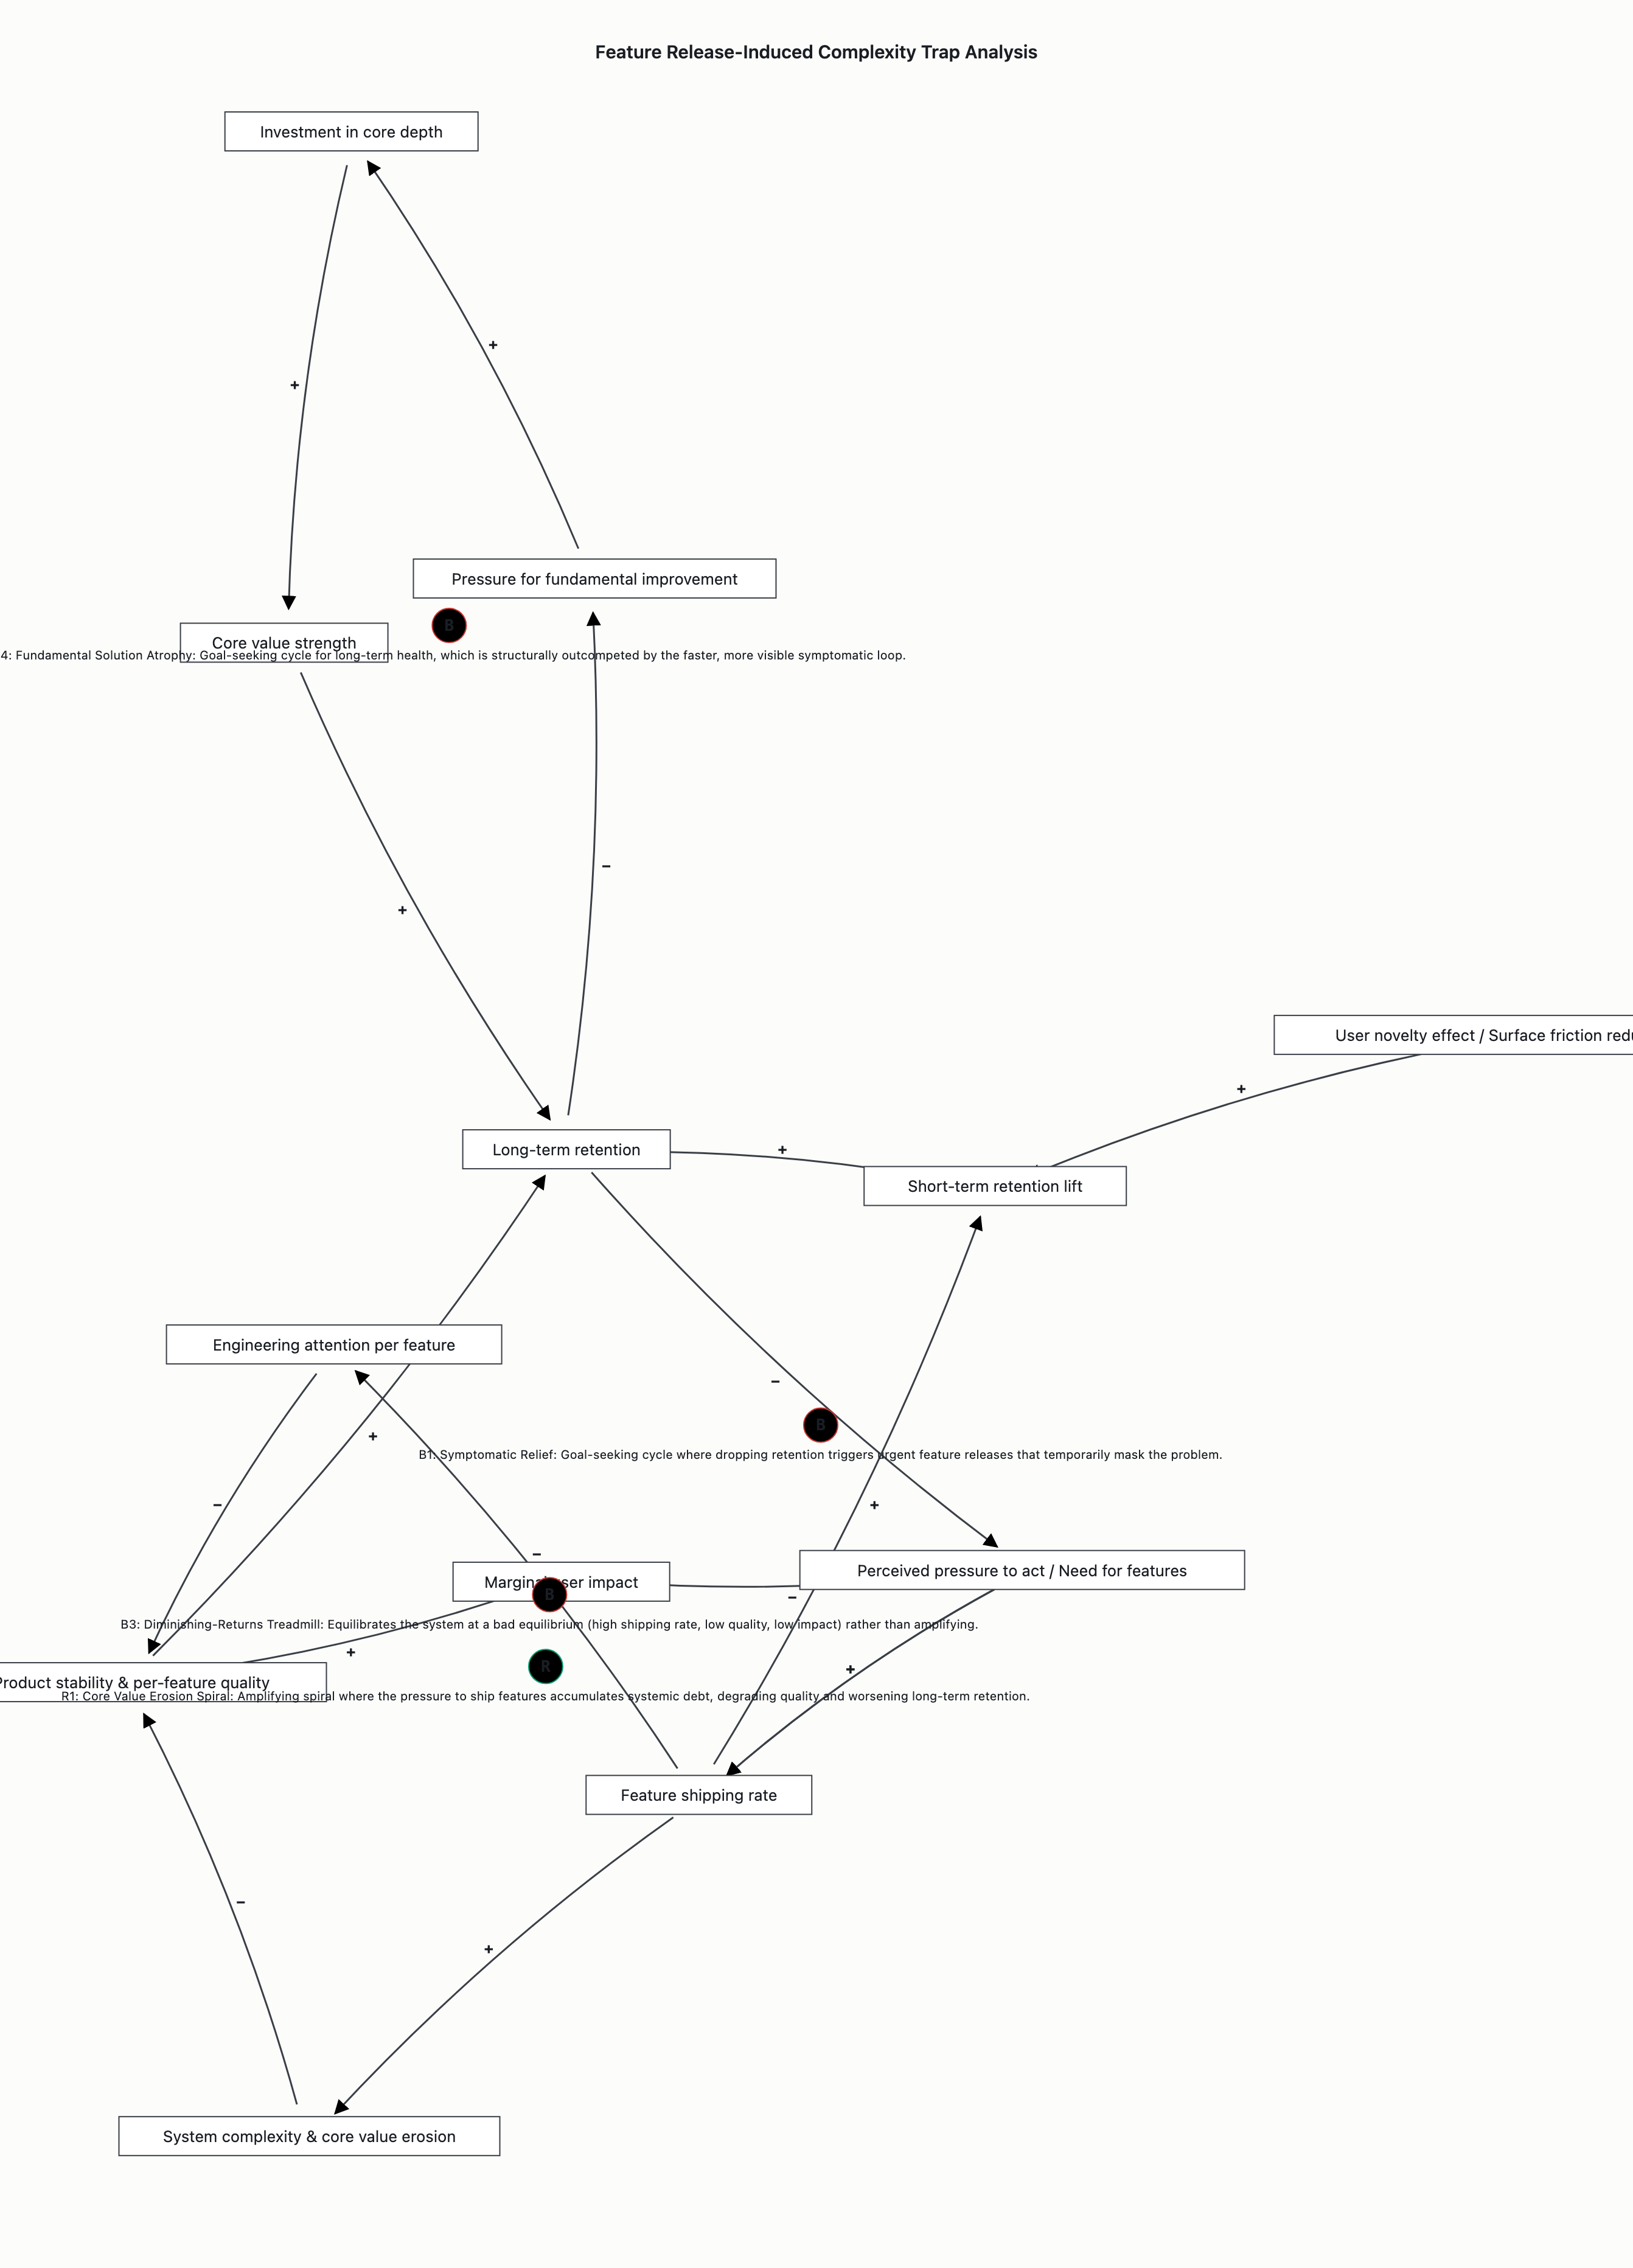
Inside: The endogenous product development and user-experience dynamics, specifically: long-term retention, short-term retention lift, perceived pressure to act/need for features, feature release/shipping rate, short-term perceived value (friction reduction/novelty), system complexity and technical debt (core value erosion), per-feature quality, engineering attention per feature, UI/mental-model fragmentation, investment in core depth, and core value strength. Outside (deliberately excluded): Macroeconomic user behavior shifts, pricing/business model changes, platform/regulatory shifts, total addressable market size, long-term user-acquisition channel quality, and competitive dynamics/market saturation. The prompt specifies the pattern is triggered by every feature release, indicating an endogenous feedback dynamic. If competitor actions, acquisition channels, or macro conditions were the dominant drivers, the pattern would be asynchronous to the release cycle rather than predictably and immediately tied to it. Observer-position note: The product team, analysts, and leadership are inside the system being analyzed. Your natural, well-intentioned reaction to a retention dip (deploying a feature fix) is the exact input variable that drives the Reinforcing (R1) complexity trap. Furthermore, your own success metrics (sprint velocity, features shipped) represent positive edges in R1 and B3. You cannot stand outside and “fix” the system; you must change the rules by which you react to it, requiring external, longitudinal evaluation to break the self-referential observation loop.
Variables
- Feature shipping rate — kind: Flow. Unit: Features released per unit time. Short label: Ship Rate.
- Long-term retention — kind: Stock. Unit: Cohort retention over time. Short label: LTR.
- Short-term retention lift — kind: Stock/Transient. Unit: Immediate retention gain (weeks post-release). Short label: ST Lift.
- Perceived pressure to act / Need for features — kind: Auxiliary. Unit: Organizational urgency. Short label: Pressure.
- System complexity & core value erosion — kind: Stock. Unit: Cumulative burden of overlapping features and architectural shortcuts. Short label: Core Erosion.
- Product stability & per-feature quality — kind: Auxiliary. Unit: Subjective and objective reliability, polish, and integration care. Short label: Quality.
- Engineering attention per feature — kind: Auxiliary. Unit: Available engineering resources / shipping rate. Short label: Attention.
- User novelty effect / Surface friction reduced — kind: Stock/Auxiliary. Unit: Immediate utility or transient boost. Short label: Novelty.
- Investment in core depth — kind: Flow. Unit: Engineering effort spent deepening the core value proposition. Short label: Core Investment.
- Core value strength — kind: Stock. Unit: Durability, polish, and coherence of the original value proposition. Short label: Core Strength.
- Pressure for fundamental improvement — kind: Auxiliary. Unit: Pull on team attention to invest in core depth. Short label: Fundamental Pressure.
Feedback loops with polarity
Loop B1 (Symptomatic Relief): Type: B. Members in order: Long-term retention [-] Perceived pressure to act [+] Feature shipping rate [+] Short-term retention lift [+] Long-term retention. Edge polarities: -, +, +, +. Polarity-parity check: 1 negative edge (odd) → Balancing (B). Matches declared type. Behaviour-grounded label: Goal-seeking cycle where dropping retention triggers urgent feature releases that temporarily mask the problem.
Loop R1 (Core Value Erosion Spiral): Type: R. Members in order: Long-term retention [-] Perceived pressure to act [+] Feature shipping rate [+] System complexity & core value erosion (Delay D1a) [-] Product stability & per-feature quality (Delay D1b) [+] Long-term retention. Edge polarities: -, +, +, -, +. Polarity-parity check: 2 negative edges (even) → Reinforcing (R). Matches declared type. Behaviour-grounded label: Amplifying spiral where the pressure to ship features accumulates systemic debt, degrading quality and worsening long-term retention.
Loop B3 (Diminishing-Returns Treadmill): Type: B. Members in order: Feature shipping rate [-] Engineering attention per feature [-] Per-feature quality [+] Marginal user impact [-] Perceived need for more features [+] Feature shipping rate. Edge polarities: -, -, +, -, +. Polarity-parity check: 3 negative edges (odd) → Balancing (B). Matches declared type. Behaviour-grounded label: Equilibrates the system at a bad equilibrium (high shipping rate, low quality, low impact) rather than amplifying, explaining the “vicious” feel despite being mechanically balancing.
Loop B4 (Fundamental Solution Atrophy): Type: B. Members in order: Long-term retention [-] Pressure for fundamental improvement [+] Investment in core depth [+] Core value strength [+] Long-term retention. Edge polarities: -, +, +, +. Polarity-parity check: 1 negative edge (odd) → Balancing (B). Matches declared type. Behaviour-grounded label: Goal-seeking cycle for long-term health, which is structurally outcompeted by the faster, more visible symptomatic loop.
Delays
- D1a (Accumulation/Recognition Lag) — delay magnitude: Months/quarters. Implication: Hides the immediate compounding cost of each release, making the symptomatic fix appear cost-free.
- D1b (Manifestation Lag) — delay magnitude: Quarters/years. Implication: Hides the user-facing degradation until multiple releases compound, preventing timely course correction.
- Habituation Delay — delay magnitude: Weeks. Implication: Hides the fact that the short-term lift is transient, creating a false confidence in the feature fix. The structural argument relies only on the delay being longer than the team’s decision cycle.
- Core-Depth Investment Delay — delay magnitude: Quarters/years. Implication: Hides the benefits of fundamental solutions, making them appear structurally less effective than symptomatic fixes within a standard planning cycle.
System archetypes
- Fixes That Fail — matching loop topology: Balancing loop B1 supplies the symptomatic relief (fix reduces retention pressure), whose side-effects strengthen Reinforcing loop R1 (amplifying core value erosion). Behaviour predicted: Every feature release initially reduces retention pressure, but the delayed side-effect of accumulated complexity guarantees a worse retention state later, triggering more “fixes.”
- Shifting the Burden — matching loop topology: Dominant symptomatic solution loop B1 and an atrophying fundamental solution loop B4. Behaviour predicted: The team structurally defaults to shipping features because B1 provides fast, visible relief. B4 starves for resources because its feedback delay is longer than B1’s, not because the team lacks willpower.
- Limits to Growth — matching loop topology: Initial reinforcing mechanism (early releases compounding value) which eventually triggers balancing limit B3. Behaviour predicted: The system stabilizes at a bad equilibrium where a high shipping rate dilutes engineering attention, collapsing per-feature quality and marginal impact, requiring ever more features to achieve the same short-term lift.
Leverage points — Meadows-ranked
- Shift the organizational mental model — Meadows depth: 2 (Paradigm - Very High Leverage). Description: Transition from the belief that “more features = better retention” to “subtraction, coherence, and sustained reliability drive retention.” Why this depth: Without this paradigm shift, every other fix is undermined by the next release cycle’s default behavior. Expected effect on the dominant loop: Defunds the urgency that drives Loop B1 and Loop R1.
- Replace primary success metrics — Meadows depth: 3 (Goals - Transformative Leverage). Description: Replace feature shipping velocity with 90-day cohort retention impact as the primary team success metric. Why this depth: The system optimizes whatever is measured; the current goal directly produces the cyclical behavior. Expected effect on the dominant loop: Reorients team behavior away from the symptomatic Loop B1 toward Loop B4.
- Structurally decouple fundamental-solution resources — Meadows depth: 4 (Self-organisation - High Leverage). Description: Create separate teams, budgets, and metrics for core-depth investment, isolating them from the symptomatic-fix resource queue. Why this depth: Willpower alone cannot save Loop B4 when Loop B1 is structurally dominant and faster. Expected effect on the dominant loop: Prevents resource starvation of Loop B4, allowing it to compete with Loop B1.
- Cap shipping rate and mandate feature retirement — Meadows depth: 5 (Rules - High Leverage). Description: Cap the feature shipping rate and mandate the retirement of one existing feature for every new feature introduced. Why this depth: Directly intervenes on the flow driving R1 and B3, imposing structural constraints on accumulation. Expected effect on the dominant loop: Reduces the inflow into System complexity & core value erosion, slowing R1.
- Surface long-term data in launch reviews — Meadows depth: 6 (Information Flows - Medium-High Leverage). Description: Present long-term cohort retention data and system complexity metrics in the same launch review as short-term retention spikes. Why this depth: Breaks the illusion that the short-term fix is cost-free by making hidden information visible. Expected effect on the dominant loop: Increases the perceived cost of Loop B1, tempering organizational pressure.
8–12. Tweak parameters and loop strengths — Meadows depth: 8–12 (Parameters & Loop Strengths - Low Leverage). Description: Adjusting engineers per feature, release cadence caps, or tuning balancing feedback strength. Why this depth: Without engaging Depths 2–4, parameter tweaks are merely superficial adjustments. Expected effect on the dominant loop: Only changes the frequency or amplitude of the R1 cycle iteration; does not break the cycle.
Counterintuitive behaviours
- Acceleration Worsens the Symptom — grounded in loops: R1 and B3. Observable signal: Increasing resources, budget, or urgency dedicated to “fixing” retention faster will accelerate long-term retention degradation, as accelerating the shipping rate directly feeds the accumulation of system complexity and dilutes per-feature quality.
- The Feature Freeze Advantage — grounded in loops: R1 and B3 (by halting their inflows). Observable signal: A feature freeze with zero new releases will improve long-term retention faster than shipping another well-designed feature, as stopping the shipping rate halts accumulation, allowing existing features to compound in value through user habituation.
- High-Impact Features Cause Maximum Long-Term Damage — grounded in loops: B3 and R1. Observable signal: Features producing the largest short-term retention lift produce the largest long-term damage, because they either create the highest user dependency (making subsequent complexity drops more painful), attract the most diverse cohorts (highest dilution effect), or consume the most engineering attention.
- Structural Starvation of Core Investment — grounded in loops: B1 and B4. Observable signal: The team’s instinct to “invest in core depth” will be perpetually starved by the symptomatic shipping loop. The atrophy of B4 is a structural consequence of loop gains and delay disparities, not a failure of team values or willpower.
Confidence and boundary caveats
- Loop B1 — confidence: High. Basis: The short-term causal chain is observationally well-supported in software product cycles. Boundary caveat: If competitor-feature parity were moved inside the boundary, the
Feature shipping rate -> Short-term perceived value edge would weaken. This would reduce B1’s corrective strength, lengthen the time between release and the next retention dip, and make the short-term “fix” less effective at masking the underlying problem.
- Loop R1 — confidence: High. Basis: The cumulative-debt mechanism with compound delays is structurally clear and matches canonical system dynamics literature for this failure mode. Boundary caveat: If the recurring issue were a non-accumulating, single-point bug, the System Complexity stock would not accumulate per release, and R1’s mechanism would not fire. Additionally, if a “Refactoring Investment” stock were explicitly included and actively, systematically defunded by leadership choice, the archetype mapping would shift more accurately toward Shifting the Burden rather than purely Fixes That Fail.
- Loop B3 — confidence: Medium. Basis: Contested applicability depending on scale. Boundary caveat: Requires the feature shipping rate to have crossed a specific dilution threshold. If the team is small and shipping rate is low, this loop may not be active yet; R1 alone would explain the pattern.
- Loop B4 — confidence: Medium. Basis: Contested applicability depending on historical behavior. Boundary caveat: Depends on the team having pre-existing core-value-investment behavior to atrophy. If the team has never invested in core depth, B4 starts at zero. The structural recommendation (decouple resources) holds in both cases, but the “atrophy” framing applies only if the behavior existed previously.
(visual rendered — see artifact)
System boundary
Inside: feature release rate/cadence; product complexity / feature-surface complexity / tech debt; core product quality (decomposed as user cognitive load → perceived simplicity → core task completion); perceived product novelty; user habituation; feature familiarity; marginal retention lift per release; initial retention lift; retention rate; management/ship pressure; gap to target retention; short-term metric framing; feature quality/fit; dependency on quick fixes; root-cause diagnostic capability; underlying retention driver.
Outside (deliberately excluded): competitor feature releases; macroeconomic/seasonal retention drivers; pricing/monetisation changes; marketing-driven shifts in user mix/acquisition channels; hiring/turnover of team members; AI-agent / automated-optimisation systems.
Rationale: The prompt asks to diagnose a self-inflicted recurring paradox (“fixing X makes things worse”), which is an endogenous structural failure; admitting exogenous variables dilutes causal clarity. Specifically, competitor releases could cause retention drops exogenous to the team’s own releases and would exonerate the release strategy, reducing R1’s apparent share; pricing would create drops the team may misattribute to product complexity; acquisition-mix shifts change baseline retention independently of product decisions; automated optimisation agents, if admitted in-boundary, would shift the dominant-loop story from “human-team pressure” to “metric-driven optimisation.”
Observer-position note: the analyst / user is part of this system; their behaviour is itself a variable in Loop R-observer. The analysis below accounts for this rather than positioning the observer outside. The user’s own choices drive Feature Release Rate; their dashboards that highlight short-term novelty wins while omitting long-term complexity debt actively instantiate Short-term Metric Framing, creating a positive edge to Pressure. The user’s framing of the problem (“why does fixing make it worse?”) is itself a feedback signal indicating the paradigm is being questioned. The analysis and recommendations become inputs reshaping the team, metrics, and framing.
Variables
- Retention Rate — kind: Stock / auxiliary symptom metric. Unit: Primary symptom metric. Short label: Retention Rate.
- Feature Release Rate — kind: Flow. Unit: Velocity of new features/“fixes” to production. Short label: Release Rate.
- Pressure to Ship (Mgmt Pressure) — kind: Auxiliary. Unit: Organisational urgency; rises as retention falls. Short label: Pressure to Ship.
- Gap to Target Retention — kind: Auxiliary. Unit: Distance between current and target retention. Short label: Gap to Target.
- Perceived Product Novelty — kind: Auxiliary. Unit: Short-term perception of freshness/added value. Short label: Novelty.
- Initial Retention Lift — kind: Auxiliary. Unit: The fast, visible post-release bump. Short label: Initial Lift.
- Product Complexity / Tech Debt — kind: Stock. Unit: Accumulated cognitive load, UI clutter, code fragility. Short label: Complexity.
- User Cognitive Load — kind: Auxiliary. Unit: Mediating step from complexity to usability. Short label: Cognitive Load.
- Perceived Product Simplicity — kind: Auxiliary. Unit: Mediating step. Short label: Simplicity.
- Core Task Completion Rate / Core Quality-Usability — kind: Auxiliary. Unit: Baseline reliability/ease of completing core tasks. Short label: Core Quality.
- User Habituation — kind: Stock (tension: also declared auxiliary). Unit: Degree users have adapted/desensitised to features. Short label: Habituation.
- Feature Familiarity — kind: Auxiliary. Unit: Familiarity with existing surface; lowers marginal novelty. Short label: Familiarity.
- Marginal Retention Lift per Release — kind: Auxiliary. Unit: Declining return per release. Short label: Marginal Lift.
- Short-term Metric Framing — kind: Auxiliary. Unit: Reporting focus on novelty wins, omitting complexity debt. Short label: Metric Framing.
- Feature Quality / Fit — kind: Auxiliary (moderator). Unit: Determines whether a release simplifies (high fit) or adds clutter (low fit); moderates Release → Complexity. Short label: Feature Fit.
- Dependency on Quick Fixes — kind: Auxiliary. Unit: Reliance on symptomatic release as the response. Short label: Quick Fix Dependency.
- Root-Cause Diagnostic Capability — kind: Stock. Unit: Team’s capacity to find/fix fundamental causes; atrophies with disuse. Short label: Diagnostic Capability.
- Underlying Retention Driver — kind: Stock. Unit: The fundamental cause of retention, addressed only by diagnostic capacity. Short label: Retention Driver.
(Note on variable tension: Habituation is declared as a stock in one treatment and an auxiliary in the other. Core quality is treated either as a single auxiliary or decomposed into a three-step chain. Both granularities describe the same causal pathway.)
Feedback loops with polarity
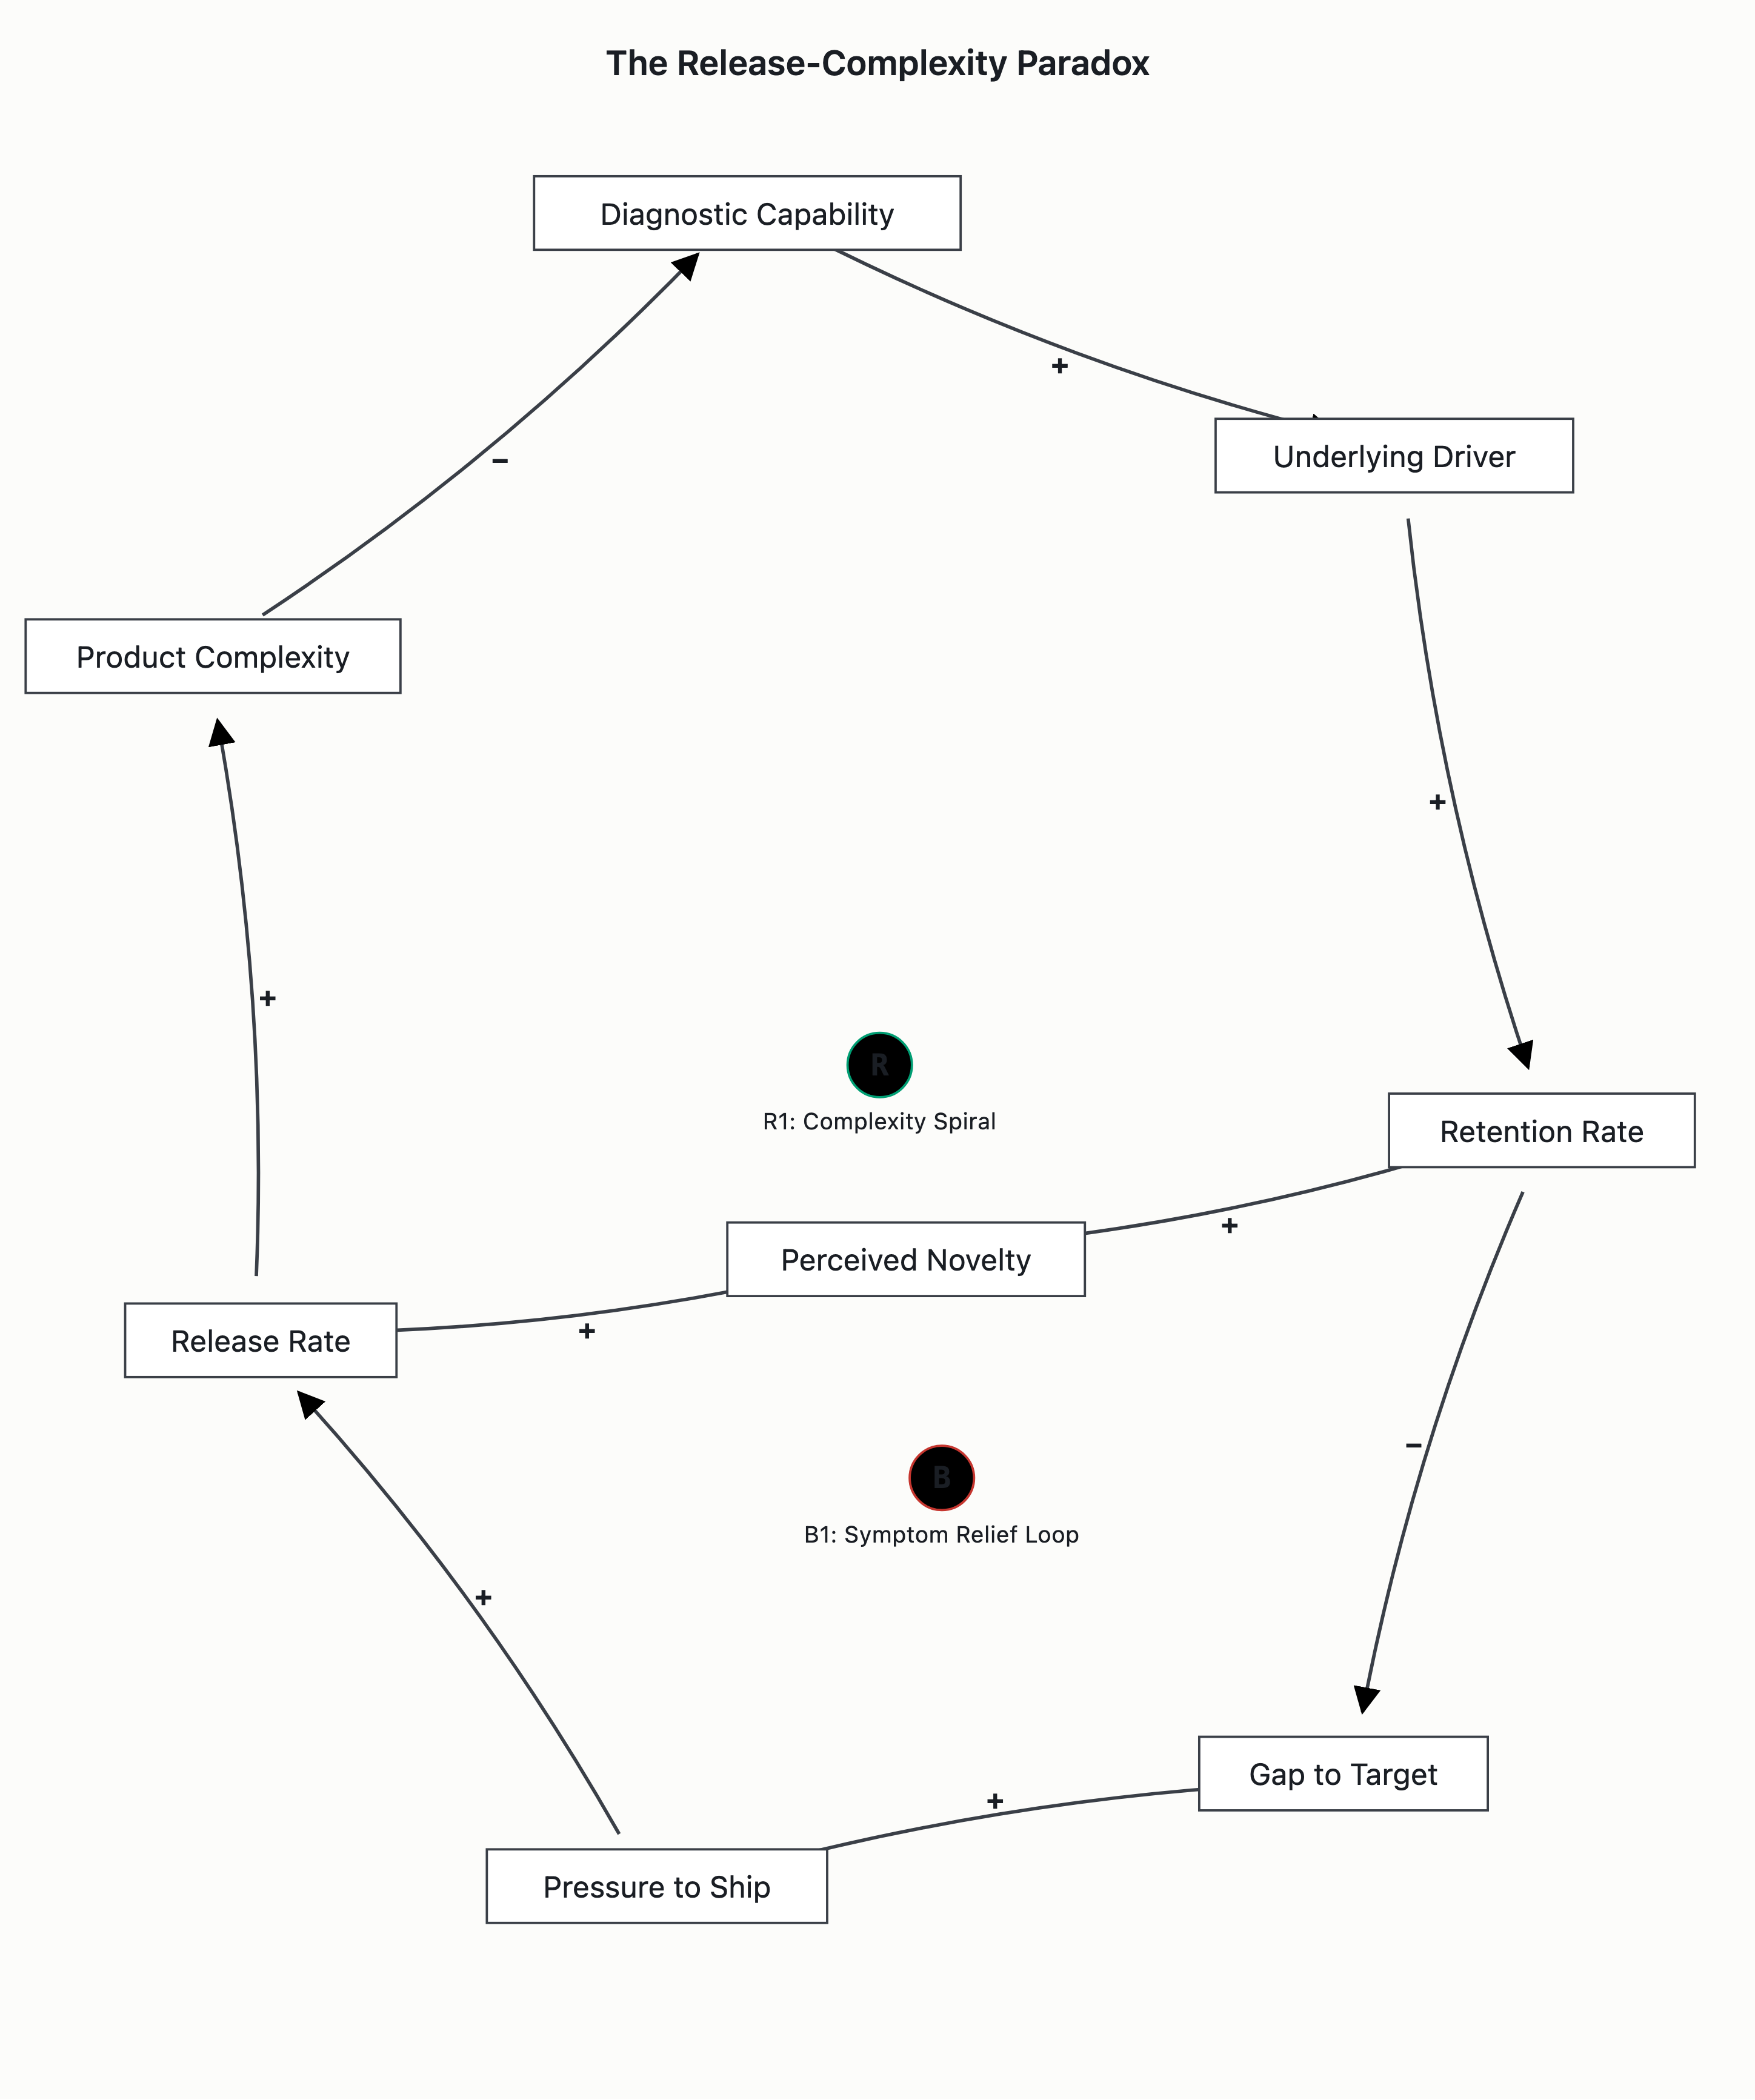
Loop B1: Type: B. Members in order: Retention → Gap to Target Retention → Pressure to Ship → Feature Release Rate → Perceived Product Novelty / Initial Retention Lift → Retention. Edge polarities: Retention → Gap (−); Gap → Pressure (+); Pressure → Release (+); Release → Initial Lift/Novelty (+); Initial Lift/Novelty → Retention (+). Polarity-parity check: 1 negative edge → odd → B; matches declared type. Behaviour-grounded label: The fast loop that produces the visible “fix worked” signal (Symptom Relief).
Loop R1: Type: R. Members in order: Feature Release Rate → Product Complexity → User Cognitive Load → Perceived Product Simplicity → Core Task Completion / Core Quality → Retention → Pressure to Ship → Feature Release Rate. Edge polarities: Release → Complexity (+) (moderated by Feature Quality/Fit); Complexity → Cognitive Load (+); Cognitive Load → Perceived Simplicity (−); Perceived Simplicity → Core Task Completion (+); Core Task Completion/Quality → Retention (+); Retention → Pressure (−); Pressure → Release (+). Polarity-parity check: 2 negative edges → even → R; matches declared type. Behaviour-grounded label: Complexity Death Spiral / Long-Term Degradation.
Loop R2: Type: R. Members in order: Dependency on Quick Fixes → Root-Cause Diagnostic Capability → Underlying Retention Driver → Retention → Pressure to Ship → Feature Release Rate → Dependency on Quick Fixes. Edge polarities: Dependency → Diagnostic Capability (−) (slow); Diagnostic Capability → Retention Driver (+); Retention Driver → Retention (+); Retention → Pressure (−); Pressure → Release (+); Release → Dependency (+). Polarity-parity check: 2 negative edges → even → R; matches declared type. Behaviour-grounded label: Shifting the Burden / Diagnostic Atrophy.
Loop R-observer: Type: R. Members in order: Retention (short-term bump) → Short-term Metric Framing → Pressure to Ship → Feature Release Rate → Perceived Product Novelty → Retention. Edge polarities: Retention → Metric Framing (+); Metric Framing → Pressure (+); Pressure → Release (+); Release → Novelty (+); Novelty → Retention (+). Polarity-parity check: 0 negative edges → even → R; matches declared type. Behaviour-grounded label: Observer-Driven Metric Framing.
Loop B2: Type: B. Members in order: Perceived Product Novelty → User Habituation → Perceived Product Novelty. Edge polarities: Novelty → Habituation (+); Habituation → Novelty (−). Polarity-parity check: 1 negative edge → odd → B; matches declared type. Behaviour-grounded label: Local novelty dampener (habituation loop).
Loop R3: Type: R. Members in order: Feature Release Rate → User Habituation → Feature Familiarity → Marginal Retention Lift per Release → Initial Retention Lift → Retention → Pressure to Ship → Feature Release Rate. Edge polarities: Release → Habituation (+); Habituation → Familiarity (+); Familiarity → Marginal Lift (−); Marginal Lift → Initial Lift (+); Initial Lift → Retention (+); Retention → Pressure (−); Pressure → Release (+). Polarity-parity check: 2 negative edges → even → R; matches declared type. Behaviour-grounded label: Novelty-Habituation dynamic driving diminishing returns.
Delays
- Release → Complexity → Quality erosion — delay magnitude: weeks–months. Implication: Complexity and tech debt compound silently; users tolerate minor UX degradation initially, masking the accumulation.
- Quality → Retention (churn delay) — delay magnitude: weeks–months (highly context-dependent). Implication: Time between degraded experience and the user’s actual decision to stop using the product.
- Release → Novelty (development & discovery delay) — delay magnitude: weeks to months. Implication: Time required to build the feature and for users to notice it.
- Novelty/Initial Lift → Retention (adoption delay) — delay magnitude: days–weeks. Implication: N-day/weekly/monthly retention windows smooth the immediate response, delaying the true signal.
- Novelty → Habituation / Release → Familiarity → Marginal-lift erosion — delay magnitude: weeks–months. Implication: Users adapt over weeks; marginal-effect decay is delayed, meaning short-window data shows “fixes work” while longer-window data shows the opposite.
- Release → Diagnostic Capability atrophy — delay magnitude: quarters–years. Implication: The slowest dynamic in the system; the negative polarity of Dependency → Diagnostic Capability is most misleading without this delay marked, as the atrophy is not immediately observable.
System archetypes
- Fixes That Fail — matching loop topology: B1 (Symptom Relief) and R1/R2/R3 (Complexity Death Spiral, Shifting the Burden, Novelty Habituation). Behaviour predicted: A symptomatic fix (Feature Release Rate ↑) provides short-term relief (B1 → Initial Lift → Retention ↑). However, side effects from R1, R2, and R3 generate erosion that eventually drives Retention below the starting point. The relief path and the side-effect path share the Pressure variable, completing the canonical Fixes-That-Fail skeleton.
- Shifting the Burden — matching loop topology: R2. Behaviour predicted: A fundamental capability (Root-Cause Diagnostic / architectural refactoring) atrophies as the symptomatic fix (release velocity) handles the problem superficially. The fundamental fix is crowded out by long delay and high initial cost, and the organisation grows increasingly dependent on symptomatic releases to sustain an illusion of progress.
- Eroding Goals (partial candidate) — matching loop topology: Gap to Target Retention (conditional on team behaviour). Behaviour predicted: If the team observes repeated erosion and gradually lowers the retention target, the Gap shrinks, Pressure drops, Release Rate drops, and the cycle appears to break — until the next crisis.
Leverage points — Meadows-ranked
- Transcend the “retention = features” frame — Meadows depth: 1. Description: Power to step outside the prevailing operational frame entirely. Why this depth: Highest leverage, redefines the entire system paradigm. Expected effect on the dominant loop: Dissolves the causal framing that drives the cycle.
- Replace operating belief: “retention requires shipping more features” — Meadows depth: 2. Description: Shift to “retention comes from core value clarity / core-experience refinement, not feature accumulation”; treat simplicity and reliability as the primary features (raising Feature Quality/Fit as default standard). Why this depth: Transcends the loop by redefining what a “fix” is without requiring total paradigm transcendence. Expected effect on the dominant loop: Neutralizes R1 and R-observer by changing the default standard of a release.
- Change goals from activity proxies to outcome metrics — Meadows depth: 3. Description: Current goals proxy activity (“ship N features/quarter,” “increase retention by X%”). Change to depth-of-engagement per active user, time-to-first-value, 90-day cohort retention. Why this depth: Alters the structural targets driving organisational pressure. Expected effect on the dominant loop: Decouples Release Rate from short-term retention bumps.
- Empower team self-organisation to pause, deprecate, or refactor — Meadows depth: 4. Description: Empower the team to redesign its own delivery pipeline / choose not to ship — deprecation, simplification, freeze decisions, cross-functional autonomy to pause feature work and execute fundamental refactoring. Why this depth: Shifts the system’s self-organisation rules away from symptomatic fixes. Expected effect on the dominant loop: Weakens Dependency on Quick Fixes, slowing R2.
- Structural constraints over “always shipping” — Meadows depth: 5. Description: Replace “must always be shipping” cadence with structural constraints — “One In, One Out,” mandatory complexity budgets, “no net-new feature without a 90-day retention-decay projection.” Why this depth: Alters the rules governing flow into the Complexity stock. Expected effect on the dominant loop: Prevents Complexity stock from growing monotonically with Release Rate, protecting Core Quality (R1).
- Change information flows and visibility — Meadows depth: 6. Description: Change what is measured/visible/rewarded. Surface per-feature 90-day retention decay to whoever ships, and gate promotion/success on long-term retention and system stability. Why this depth: Alters the feedback information routing to decision-makers. Expected effect on the dominant loop: Alters the input to Pressure, breaking R-observer.
- Weaken reinforcing-loop gain — Meadows depth: 7. Description: Weaken R1 via complexity budgets; weaken R3 via usage-boredom counter-signals; weaken R2 by allocating dedicated diagnostic time. Why this depth: Adjusts the gain of specific feedback loops. Expected effect on the dominant loop: Reduces the amplifying effect of R1, R2, and R3.
- Reduce balancing-loop gain (B1 dominance) — Meadows depth: 8. Description: Make B1 less dominant — require retention signals beyond the immediate window before crediting a release. Why this depth: Alters the gain of the fast balancing loop. Expected effect on the dominant loop: Stops the fast loop from masking the structural damage of the R-loops.
- Shrink the feedback delay — Meadows depth: 9. Description: Shrink the feedback delay between quality degradation and management action via automated “complexity tax” metrics (code churn, UX friction scores) that trigger mandatory refactoring sprints. Why this depth: Shortens information delay, making invisible erosion surface faster. Expected effect on the dominant loop: Makes D1–D3 visible in days, preventing unchecked accumulation.
- Increase buffers — Meadows depth: 11. Description: Onboarding/support capacity absorbs complexity cost temporarily. Why this depth: Modifies system buffers. Expected effect on the dominant loop: Hiding R1 damage temporarily rather than fixing it.
- Tweaking parameters — Meadows depth: 12. Description: Tweaking release cadence or adding engineers. Why this depth: Lowest leverage, easily overwhelmed by R1’s momentum; adding headcount to a complex, late system adds coordination overhead (Brooks’s Law, 1975) and can worsen the problem. Expected effect on the dominant loop: Minimal or negative effect; exacerbates complexity.
Recommendation hierarchy: Primary moves at Depth 1–5 (paradigm → goals → rules → information flows → reduce delay). Anti-recommendation: “Ship fewer features” or “freeze releases for a quarter” treats the symptom. R1/R2/R3 will resume once the freeze ends because the paradigm, goals, and rules remain unchanged.
Counterintuitive behaviours
- Illusion (“fixes work”) — grounded in loops: B1, R1/R2/R3. Observable signal: Each release produces a measurable lift via B1; the team concludes the strategy works. Erosion from R-loops is delayed and invisible in the immediate post-release window — the team’s strongest evidence that “fixes work” is the same evidence masking structural damage.
- Intervention worsens — grounded in loops: R1, R2, R3. Observable signal: The standard response to a retention drop — ship more features — raises Release Rate, strengthening all R-loops simultaneously; the act of “fixing” accelerates the underlying erosion, moving the system further from equilibrium each iteration.
- Steeper decline — grounded in loops: R1, R-observer. Observable signal: Accelerating releases to fix declining retention causes, after a compounding delay, a steeper long-term decline than if no intervention had occurred. The team misreads the initial bump as validation; when retention collapses via R1 they conclude features were “not good enough” or “shipped too slowly” and release even faster, accelerating collapse into feature bloat and technical insolvency while atrophying fundamental-fix capacity.
- Threshold collapse — grounded in loops: R1, R2, R3. Observable signal: If R-loops run unchecked, baseline Retention crosses below the original starting point; from there even a successful release is net-negative because the B1 lift is smaller than cumulative R1/R2/R3 erosion (“shipped a feature, retention rose briefly, then crashed below where we started”).
- Diminishing returns — grounded in loops: R3. Observable signal: Marginal Retention Lift per release declines over time via R3 even when each release is well-designed; the team must ship increasingly larger/novel features for the same lift — and even that fails once R3 saturates.
- Goodhart’s Law — grounded in loops: R-observer, R1. Observable signal: When teams are rewarded on proxy metrics (“retention lift per release,” “feature adoption rate”), they optimise the proxy rather than the underlying goal — shipping features that spike the proxy while degrading deeper retention; the proxy ceases to measure retention. (The primary actor is the human team; AI agents / automated optimisation systems are an accelerator of this already-present dynamic).
Confidence and boundary caveats
- B1 — Symptom Relief: High. Basis: Short-term lift is the most observable feature of the system; its short-window dominance over the R-loops is exactly the source of the paradox. Boundary caveat: None specific.
- R1 — Complexity Death Spiral: Medium-High. Basis: Complexity degrading quality and thus retention aligns with established software-engineering literature (technical debt, feature bloat). Boundary caveat: Excluding competitors means R1 is the dominant internal driver; including competitors would reduce R1’s share of observed drops. If an excluded competitor introduces a superior, simpler alternative during the churn-delay window, the churn delay collapses and accelerates R1’s destructive effect.
- R2 — Shifting the Burden: Medium-High. Basis: Dependency/diagnostic-atrophy dynamic is well-established (Senge, Argyris). Boundary caveat: Excluding turnover means R2 may be understated if key diagnostic personnel have left the organisation.
- R3 / B2 — Novelty Habituation: Medium-High. Basis: Short-term novelty bump and subsequent decay are robust in product analytics and behavioural psychology. Boundary caveat: Loop strength relative to R1 depends on product type (consumer novelty-driven products are more susceptible). The model assumes uniform positive response to initial novelty; segment-level user-research data would be needed to resolve whether novelty produces immediate churn for certain segments.
- R-observer — Observer-Driven Metric Framing: High. Basis: Well-documented cultural dynamic in velocity-metric-focused tech organisations. Boundary caveat: None specific.
- Counterintuitive-behaviour magnitude: Medium. Basis: The “steeper, long-term decline” prediction is directionally sound on R1’s reinforcing parity. Boundary caveat: Exact magnitude cannot be verified without numerical parameterisation, which is outside the qualitative contract.
(visual rendered — see artifact)
System boundary
This analysis treats the feature-release → retention cycle as an endogenous feedback system. Inside the boundary: retention; the team’s “ship-to-close-the-gap” release-rate decision rule (and the pressure-to-ship auxiliary it acts through); feature release rate; novelty / perceived freshness; user expectation baseline; product complexity / surface area; cognitive load / UI friction; team capacity split between new-feature work and maintenance; core-experience quality; surviving-base complexity tolerance; revenue/funding for releases; and simplification/deprecation effort.
Outside the boundary (deliberately excluded): competitor releases; pricing/packaging; acquisition-channel / cohort-mix quality (promoted to a named rival hypothesis — see the diagnosis below); seasonality; macro conditions.
How the exclusions would change the story: acquisition cohort-mix is the dangerous exclusion, handled explicitly as the rival hypothesis — if each cohort enters lower-intent than the last, complexity is a bystander and the dominant loop sits outside this boundary. Competitor releases would make some retention dips exogenous (a rival shipped, not your complexity); they are excluded to keep the loops endogenous, but this is not genuinely zero and is reflected in per-loop confidence.
Observer-position note: the analyst / user is part of this system; their behaviour is itself a variable. The product team is not outside the structure being analysed. The decision rule — “retention dipped → ship more features” — is the actuator on the release rate (REL) and the gain on the reinforcing loops. The intervention the team reaches for instinctively is the one the structure punishes. The novelty bump rewards the people who authorize the next release, which is exactly why the quick-fix loop (B1) keeps getting pulled and the simplification/maintenance loops (B5, B3) stay starved. Any intervention at depth 2/3/5/6 is a decision the team has standing to make, and resistance will come from inside the boundary.
Variables
- RET — Retention — kind: stock. Unit: retained users. Short label: RET.
- GAP — Retention shortfall (target − RET) — kind: auxiliary. Unit: retention deficit. Short label: GAP.
- PRESS — Pressure to ship — kind: auxiliary. Unit: decision-rule intensity. Short label: PRESS.
- REL — Feature release rate — kind: flow. Unit: releases / time. Short label: REL.
- NOV — Novelty / perceived freshness — kind: stock (Stream-modeled; drains via habituation) / transient. Unit: freshness. Short label: NOV.
- EXP — User expectation baseline — kind: stock (ratchets up). Unit: expectation level. Short label: EXP.
- CPX — Product complexity / surface area — kind: stock. Unit: surface area. Short label: CPX.
- FRIC — Cognitive load / UI friction — kind: auxiliary. Unit: friction. Short label: FRIC.
- MAINT — Maintenance burden / capacity — kind: stock. Unit: maintenance load. Short label: MAINT.
- CORE — Core-experience quality — kind: stock. Unit: quality. Short label: CORE.
- TOL — Complexity tolerance of surviving base — kind: stock. Unit: tolerance. Short label: TOL.
- REV — Revenue / funding for releases — kind: stock. Unit: funding. Short label: REV.
- SIMP — Simplification / deprecation effort — kind: auxiliary. Unit: deprecation rate. Short label: SIMP.
Modeling variant on the maintenance arm (unresolved representation choice, same net effect): one representation routes REL→CAPn(+)→MAINT-capacity(−)→CORE(+) — more features consume the capacity that would polish the core; the other routes REL→MAINT-burden(+)→CORE(−) — more features grow the bug/maintenance burden that diverts from core. Both yield REL ultimately lowering CORE, and both give R2 an even negative-edge count. The intermediate polarity flips because MAINT denotes capacity (good) in one and burden (bad) in the other.
Feedback loops with polarity
The map is the structural argument, not decoration: REL is the shared lever — the fast loops (B1, B2) and the slow loops (R1, R2, R3) all pull on it. The ‖ symbol marks a delayed edge.
                          ┌──────────────── (R3) EXP ratchet ─────────────┐
                          │                                                │
              REL ──+──► NOV ──+──►‖ EXP ──−──► RET                        │
               ▲    │     │  ▲        │ (−) (below-baseline)                │
               │    │   (+)│  │(−)    └──────────────────────────► GAP ◄────┘
               │    │     ▼  │ B2-alt                                ▲ │
        (B1)   │    │    RET─┘                                  (−)  │ │ (+)
   PRESS ◄─────┘    │     │  ▲   B2: RET ──−──► NOV                  │ ▼
     ▲              │   (+)│  └──(−)── RET                      RET──┘ PRESS
     │ (+)          │      ▼                                            │
    GAP ◄──(−)── RET ◄─────┘                                           (+)
     ▲  │                                                               ▼
 (+)│   └──(+)──► PRESS ──+──► REL ──┐                                  REL
    │                               │
   RET                              ├──+──► CPX ──+──►‖ FRIC ──−──► RET   (R1 / B4 share this chain)
    ▲                               │        │  ▲                   │
   (+)                              │      (+)│  │(−) B3             │
    │                               │        ▼  │  (delayed FRIC→TOL)│
   CORE ◄──+── (MAINT arm) ◄──+─────┤      SIMP TOL                  │
    ▲   ‖                           │       │(−)                     │
    │ (R2)                          │       ▼  (B5)                  │
   MAINT ◄──────────+───────────────┘      CPX                       │
                                                                     │
   B4 budget brake:  RET ──+──► REV ──+──► REL ──+──► CPX ──+──►‖ FRIC ──−──► RET
Full edge-list (inline CLD enumeration):
| # | From | To | Polarity | Delay | Loop(s) |
|---|
| 1 | GAP | PRESS | + | — | B1, R1, R2 |
| 2 | PRESS | REL | + | — | B1, R1, R2 |
| 3 | GAP | REL | + | — | R3 (collapsed-PRESS path) |
| 4 | REL | NOV | + | — | B1, R3 |
| 5 | NOV | RET | + | — | B1, B2 |
| 6 | RET | GAP | − | — | B1, R1, R2, R3 |
| 7 | RET | NOV | − | — | B2 |
| 8 | NOV | EXP | + | ‖ | B2-alt, R3 |
| 9 | EXP | NOV | − | — | B2-alt |
| 10 | EXP | RET | − | — | R3 |
| 11 | REL | CPX | + | — | R1, B4 |
| 12 | CPX | FRIC | + | ‖ | R1, B4 |
| 13 | FRIC | RET | − | — | R1, B4 |
| 14 | REL | MAINT | + | — | R2 |
| 15 | MAINT | CORE | − | ‖ | R2 |
| 16 | CORE | RET | + | — | R2 |
| 17 | CPX | SIMP | + | — | B5 |
| 18 | SIMP | CPX | − | — | B5 |
| 19 | FRIC | TOL | + | ‖ | B3 |
| 20 | TOL | FRIC | − | — | B3 |
| 21 | RET | REV | + | — | B4 |
| 22 | REV | REL | + | — | B4 |
Loop B1 — Symptomatic fix (balancing, fast). Type: B. Members in order: GAP →(+) PRESS →(+) REL →(+) NOV →(+) RET →(−) GAP. Closing edge: RET→GAP. Polarity-parity check: negatives = 1 (odd) → B ✓ — matches declared type. Behaviour-grounded label: the loop deliberately pulled — a gap pressures a release, novelty lifts retention, the gap closes. It works, briefly. The only loop without a delay, so the only one felt immediately. (A stream that collapses GAP→REL omits PRESS; the parity is unchanged.)
Loop B2 — Novelty habituation (balancing, fast). Type: B. Members in order: NOV →(+) RET →(−) NOV. Closing edge: RET→NOV. Polarity-parity check: negatives = 1 (odd) → B ✓ — matches declared type. Behaviour-grounded label: the structural home of the “improves briefly” decay — usage erodes the novelty it rode in on, so NOV decays within the cycle. B2 alone returns retention to baseline (novelty exhaustion); by itself it does not push below baseline.
Loop B2-alt — Habituation via expectations (balancing, delayed). Type: B. Members in order: NOV →(+)‖ EXP →(−) NOV. Closing edge: EXP→NOV. Polarity-parity check: negatives = 1 (odd) → B ✓ — matches declared type. Delay on NOV→EXP. Behaviour-grounded label: a competing topology for the same “novelty wears off” phenomenon — each novel thing raises the bar for what counts as novel, draining the novelty that fed it. B2 and B2-alt are two genuinely different mechanisms for habituation (direct usage-driven decay vs. an expectations-stock intermediary); both survive, and they differ in whether habituation carries a delay and in whether an EXP stock exists to feed the below-baseline driver R3.
Loop B3 — Survivorship / self-selection (balancing, delayed). Type: B. Members in order: FRIC →(+)‖ TOL →(−) FRIC. Closing edge: TOL→FRIC. Polarity-parity check: negatives = 1 (odd) → B ✓ — matches declared type. Delay on FRIC→TOL. Behaviour-grounded label: sustained friction selectively churns out the friction-sensitive; the surviving base self-selects to tolerate complexity, so the same surface area registers as less effective friction over time. Weakly damps R1’s FRIC→RET damage — at the cost of a narrower, harder-to-grow base.
Loop B4 — Revenue / budget brake (balancing, delayed). Type: B. Members in order: RET →(+) REV →(+) REL →(+) CPX →(+)‖ FRIC →(−) RET. Closing edge: FRIC→RET. Polarity-parity check: negatives = 1 (odd) → B ✓ — matches declared type. Delay on CPX→FRIC. Behaviour-grounded label: falling retention eventually cuts the revenue/headcount that funds releases, slowing complexity accumulation. Structurally significant: B4 shares the exact REL→CPX→FRIC→RET chain with R1 but closes through the budget (RET→REV→REL, odd negatives → balancing) instead of through the decision rule (RET→GAP→REL, even negatives → reinforcing). The same release engine is governed by two opposing control loops — “ship more to fix this” (R1) vs. “can no longer afford to ship as much” (B4). B4 bites late, which is why decline plateaus rather than runs away.
Loop B5 — Simplification / deprecation (balancing, dormant). Type: B. Members in order: CPX →(+) SIMP →(−) CPX. Closing edge: SIMP→CPX. Polarity-parity check: negatives = 1 (odd) → B ✓ — matches declared type. Behaviour-grounded label: the loop that would drain complexity — but PRESS starves SIMP, so it runs far below the rate at which R1 fills CPX. Without an outflow on the CPX stock, simplification has nowhere to go. Its weakness is the disease.
Loop R1 — Complexity erosion (reinforcing, delayed). Type: R. Members in order: REL →(+) CPX →(+)‖ FRIC →(−) RET →(−) GAP →(+) PRESS →(+) REL. Closing edge: PRESS→REL. Polarity-parity check: negatives = 2 (even) → R ✓ — matches declared type. Delay on CPX→FRIC. Behaviour-grounded label: every release permanently enlarges surface area; surface area becomes friction with a delay; friction bleeds retention weeks later, widening the gap that triggers the next release. Mechanism assumption (named): R1 bites only to the degree that existing cohorts absorb the new surface area. If features are opt-in/discoverable and existing users can ignore them, the load lands mainly on new-cohort onboarding, and the decline shows as a falling new-cohort retention curve rather than decay in tenured cohorts. Which one you see localizes the fix.
Loop R2 — Capacity / maintenance starvation (reinforcing, delayed). Type: R. Members in order: REL →(+) [MAINT arm] CORE →(+) RET →(−) GAP →(+) PRESS →(+) REL. Closing edge: PRESS→REL. Polarity-parity check: negatives = 2 (even) → R ✓ — matches declared type. Delay on MAINT→CORE. Behaviour-grounded label: new-feature work eats the capacity that would polish the core (or grows the burden that diverts from it — see the variant under Variables); core quality decays with a lag; retention falls; the team responds with more features instead of investment.
Loop R3 — Expectations ratchet (reinforcing, delayed). Type: R. Members in order: REL →(+) NOV →(+)‖ EXP →(−) RET →(−) GAP →(+) REL. Closing edge: GAP→REL. Polarity-parity check: negatives = 2 (even) → R ✓ — matches declared type. Delay on NOV→EXP. Behaviour-grounded label: the same novelty that gives B1 its spike permanently raises expectations; a higher expectation baseline lowers satisfaction at unchanged quality, so retention settles below where it started — turning “dip-and-recover” into “ratchet-down.” This loop requires the EXP stock and therefore presupposes the B2-alt habituation model.
Closure check: every loop returns to its start variable along a declared edge (no linear-masquerading-as-loop). Every declared type matches its negative-edge parity.
Delays
- CPX→FRIC (R1, B4) — delay magnitude: weeks. Implication: friction bleeds retention weeks after the surface area was added, so the damage arrives after the fix already looked successful.
- MAINT→CORE (R2) — delay magnitude: weeks to a quarter. Implication: core quality decays on a lag, masking the connection between feature-work crowding and the eventual decline.
- NOV→EXP (B2-alt, R3) — delay magnitude: cycles. Implication: the expectation baseline ratchets up slowly, so the below-baseline settling appears later than the spike that caused it.
- FRIC→TOL (B3) — delay magnitude: cycles. Implication: the surviving base re-selects slowly, so the friction damping is too slow to offset R1 in the near term.
The entire symptom waveform depends on these delays: remove them and B1 simply holds retention up. The recurrence lives in the gap between the fast fix and the slow consequence. SIMP/B5 is not a delay but a dormancy (a starved rate), distinct from a time-lag.
System archetypes
- Fixes That Fail (primary) — matching loop topology: B1 (the balancing quick fix on RET/GAP) + R1 (the delayed reinforcing unintended consequence on the same symptom). Shared symptom variable = RET; the reinforcing loop carries the delay (CPX→FRIC→RET). Behaviour predicted: the delay is what makes the fix look like it worked before R1 bites. Topology matches exactly.
- Growth and Underinvestment (secondary) — matching loop topology: R2 — a growth action (releases) runs into a chronically underinvested capacity/performance variable (MAINT→CORE) with a delay before performance visibly erodes — plus the dormant B5 as the instantiation of the underfunded simplification/maintenance investment. Behaviour predicted: growth raises demand on capacity rather than directly eroding it; both loops are declared with closing edges, not name-dropped.
- R3 deliberately left unlabelled — it is a reinforcing expectations ratchet (hedonic-treadmill flavour), but its topology does not match Drifting Goals (canonical synonym: Eroding Goals): there the goal lowers; here expectations rise. Naming it would be an archetype-name-drop.
- Limits to Growth — considered and explicitly rejected — it requires a success-triggered reinforcing growth engine (growing state → more growth action) hitting a passive carrying-capacity ceiling. Here the release engine is shortfall-triggered (GAP→REL fires on a retention deficit, not on success), and CPX/FRIC is not a passive ceiling but an actively-pumped reinforcing driver (R1). The correct frame is Fixes-That-Fail / “addiction” structure, not Limits to Growth. Named to pre-empt the reader reaching for it.
Leverage points — Meadows-ranked
- Replace the “more features = more value = more retention” / “shipping = progress” paradigm with “features carry permanent complexity + expectation costs; the core experience is the product” — Meadows depth: 2 (paradigm). Description: change the belief from which the GAP→REL reflex is derived. Why this depth: deepest leverage; dissolves the GAP→REL reflex at its source. Expected effect on the dominant loop: while the old paradigm operates, the org re-derives the ship-harder reflex no matter what knobs turn — changing it disarms R1/R2/R3 at the root.
- Retarget the GAP→REL rule / optimized variable from feature velocity / engagement bump to retention durability / retained value per unit of complexity — Meadows depth: 3 (goals). Description: change what the system is trying to maximize. Why this depth: the system optimizes what it measures; the loop currently chases feature output. (Corrected from an earlier “depth 2” mislabel — Goals is depth 3.) Expected effect on the dominant loop: redirects PRESS so it no longer fires REL on every dip.
- Net-complexity-neutral release rule: every feature shipped retires one — Meadows depth: 5 (rules). Description: bind the release rate to the deprecation rate. Why this depth: directly couples the dormant balancing loop (B5) to R1’s fill rate. Expected effect on the dominant loop: caps CPX accumulation, neutralizing R1’s permanent enlargement of surface area.
- Expose the delayed, per-cohort retention damage beside the immediate spike — decompose cohort retention into novelty-lift vs. complexity-cost rather than the day-7 bump — Meadows depth: 6 (information flows). Description: close the perception gap that hides the loop-dominance flip. Why this depth: the loop-dominance flip is invisible because decision-makers see NOV fast and the R1 erosion late; close that perception gap and the decision rule changes on its own. Expected effect on the dominant loop: the cheapest high-leverage move — changes the GAP→REL decision without changing the structure underneath it.
- Reduce R1/R2/R3 gain directly — smaller releases, debt paid down per release so CPX doesn’t monotonically accumulate — Meadows depth: 7 (gain on positive loops). Description: attack the reinforcing loops at their gain. Why this depth: attacks the reinforcing loops at their gain rather than waiting on a balancing loop to counter them. Expected effect on the dominant loop: lowers the per-cycle ratchet directly.
- Add/strengthen a balancing loop: a complexity/quality gate that throttles REL when CPX/tech-debt crosses a threshold; fund deprecation/refactoring as protected capacity — Meadows depth: 8 (balancing-loop strength). Description: a designed brake distinct from the already-operating B3/B4 brakes. Why this depth: converts runaway R1/R2 into bounded behaviour; strengthens B5 and breaks R2’s starvation arm. High structural leverage. Expected effect on the dominant loop: bounds the reinforcing loops rather than merely tuning their inputs.
- Shorten the perception delay (near-real-time per-cohort retention instrumentation) and the maintenance→core delay — Meadows depth: 9 (length of delays). Description: make the lagged signals arrive faster. Why this depth: high on-point leverage — delay length is the mechanism producing the symptom. Distinct from depth 6: how fast the signal arrives, not whether it exists. Expected effect on the dominant loop: the signal arrives before the next release fires, so R1/R2/R3 can’t accumulate unseen.
- Build a deprecation pipeline so CPX can decrease at all — Meadows depth: 10 (stock/flow structure). Description: add an outflow to the CPX stock. Why this depth: without an outflow on the CPX stock, simplification (B5) has nowhere to go. Expected effect on the dominant loop: gives B5 a channel, enabling complexity to actually drain.
- Standing maintenance-capacity buffer — Meadows depth: 11 (sizes of stabilizing stocks/buffers). Description: hold reserve capacity for maintenance. Why this depth: eases R2 but is buffer-ish; treats the symptom. (Corrected from an earlier “depth 10” label; depth 10 is structure of material stocks/flows.) Expected effect on the dominant loop: dampens R2’s core-quality decay without changing the loop’s existence.
- Tune release cadence / feature count / hire more — Meadows depth: 12 (parameters). Description: adjust the knobs on the existing loops. Why this depth: lowest leverage and actively harmful — it is the gain on the vicious loops; helps only if a deeper rule/goal/paradigm also changes, else PRESS re-accelerates REL. Expected effect on the dominant loop: feeds MAINT and CPX faster — makes things worse, not better.
Recommendation (deep-leverage, sequenced): start at depth 6 (make the lagged per-cohort damage visible — low cost, immediate), pair with depth 9 (shorten the perception delay so the signal arrives before the next release fires), install the depth-8 complexity/quality gate to bound the reinforcing loops and apply depth-7 discipline (smaller releases + per-release debt paydown), then drive toward depth 3 → 2 (change the metric, then the belief). A maintenance-percentage tweak alone (depth 11–12) is the deep-leverage-omission trap — it eases R2 while leaving R1, R3, and the decision rule untouched.
Diagnosis: the recurring mechanism
The recurring mechanism is a repeated shift in loop dominance within each cycle.
- t₀–t₁ (fast): a release fires B1; NOV jumps, RET spikes. B1 dominates — the only loop without a delay.
- t₁ onward (slow): B2 drains the novelty; then the delayed reinforcing loops come due — R1 (complexity→friction), R2 (starved maintenance→core decay), R3 (raised expectations). They dominate; RET falls past the prior baseline.
- The fall widens GAP, which via the decision rule fires another release — pumping R1/R2/R3 harder while buying only another transient B1 spike.
Why “fixing X makes it worse” is structurally exact: the fix (B1) and the damage (R1/R2/R3) share the same trigger (GAP→REL). You cannot pull the fix without simultaneously feeding the loops that erode the floor. The brief-improve-then-worsen waveform is the delay difference between one fast balancing loop and the slow reinforcing ones.
Rival hypothesis (stated up front, not buried): worsening acquisition cohort-mix. The below-baseline ratchet and a degrading acquisition cohort-mix produce nearly identical aggregate retention waveforms. Discriminating test (run first): pull vintage-cohort (cohort-held / constant-source) retention curves. If within-cohort retention is flat but aggregate declines ⇒ the symptom is composition (an exogenous driver outside the boundary) and the internal R-loops are over-credited; the leverage table is aimed at the wrong system. If retention declines within fixed cohorts ⇒ the endogenous structure is doing the work. This decides which half of the diagnosis to act on.
Counterintuitive behaviours
- Increasing release cadence accelerates the decline — grounded in loops: R1/R2/R3 (permanent, accumulating) vs. B1 (transient, drained by B2). Observable signal: shipping faster raises the gain on R1/R2/R3 while B1’s contribution stays transient — higher cadence → steeper inter-cycle ratchet, more below-baseline loss per cycle.
- A release freeze / slowdown gets worse before it gets better — grounded in loops: B1 (immediate loss of novelty boost), then R2 reversing and B2-alt/R3 relaxing as delays unwind. Observable signal: stop shipping and RET first drops (immediate loss of the B1 novelty boost) — then, after the delays unwind, recovers: CPX/debt plateau, maintenance catches up and lifts CORE (R2 reverses), EXP cools (B2-alt/R3 relax). Slowing raises long-run retention while removing the visible short-run bumps. Danger: reading the initial dip as “the freeze is failing” and abandoning it before the lagged recovery arrives — the delayed feedback masks the cause in both directions. Politically hard because the dashboard rewards the bump.
- Adding engineers to ship more makes it worse, not better — grounded in loops: R1 (CPX) and R2 (MAINT). Observable signal: it feeds MAINT and CPX, the reinforcing-loop inputs, faster.
- The below-baseline ratchet is conditional on the complexity outflow being dead — grounded in loops: B3 + B4 (slow brakes that bound the fall) vs. B5 (dormant, leaving CPX with no outflow). Observable signal: one account holds the eventual plateau is produced by B3 (tolerance self-selection) + B4 (budget brake) finally engaging as slow brakes that bound the fall; the other holds the unbounded ratchet exists only while B5 (simplification) is starved and CPX has no outflow, and that any nonzero deprecation rate converts the unbounded ratchet into a bounded settling at a lower-but-stable level. Both bound the descent through different mechanisms; both survive.
Surfaced tensions (genuine, unresolved)
- Habituation mechanism. Direct usage-driven decay (B2: NOV→RET→NOV, fast, no EXP stock) vs. expectations-intermediary decay (B2-alt: NOV→EXP→NOV, delayed). The choice matters because R3 (the below-baseline ratchet driver) exists only if the EXP stock exists.
- Source of the below-baseline descent. Either an endogenous reinforcing expectations-ratchet loop (R3) actively pushes retention below baseline, or below-baseline is produced by R1/R2 dominance with the unboundedness conditional on the absence of a CPX outflow (B5 dormant). These coexist as candidate drivers; the vintage-cohort test and the ratchet-vs-flat-return question discriminate.
Confidence and boundary caveats
- B1 — confidence: high. Basis: depth and breadth agree; the intended mechanism, directly observed in “improves briefly.” Boundary caveat: the intended mechanism, robust within the stated boundary.
- B2 / B2-alt — confidence: high. Basis: habituation is the most parsimonious account of the “briefly” decay; the NOV→EXP delay length (B2-alt) is the soft parameter. Boundary caveat: which habituation topology holds is the open tension above.
- R1 — confidence: high if the decline is real and existing cohorts absorb the load; medium if load lands only on new-cohort onboarding. Basis: the Fixes-That-Fail core. Boundary caveat: CPX→FRIC magnitude depends on UX discipline and cohort incidence.
- R2 — confidence: medium / medium-high. Basis: holds only if capacity is genuinely zero-sum between features and maintenance; a separate platform team weakens it; no bug/maintenance-load series reported — may be minor relative to R1. Boundary caveat: a separate platform/maintenance team would move this arm partly outside the zero-sum assumption.
- R3 — confidence: medium. Basis: the below-baseline driver and most assumption-loaded loop. Boundary caveat: over-credited if the cohort-mix rival hypothesis is doing the work — run the vintage-cohort test.
- B3 — confidence: medium. Basis: survivorship damping is real but weak and slow. Boundary caveat: narrows the base as a side effect.
- B4 — confidence: medium. Basis: depends on releases being revenue-funded, not VC-subsidised. Boundary caveat: a long runway suppresses B4 and lets the R-loops run further before plateauing.
- B5 — confidence: medium-high as a structural claim; low on current magnitude. Basis: dormant by hypothesis (starved by PRESS). Boundary caveat: any nonzero deprecation rate changes the descent from unbounded to bounded.
Phase A assumption carried: the brief reads the pattern as ratcheting downward (each cycle’s trough below the prior). The structure produces that, but the below-baseline mechanism (R3, and/or R1/R2 dominance) is the most assumption-sensitive part. If data shows each cycle returning to the same baseline (dip-and-recover, no permanent loss), R3 is weak/absent and the story is pure Fixes-That-Fail without the ratchet — changing confidence, not structure.
Boundary caveat restated: every loop assumes constant cohort quality. If acquisition mix is drifting, the dominant loop leaves this diagram and the leverage table is aimed at the wrong system. Run the constant-source cohort test first.
- Emission contract: I cannot determine whether the mode’s emission contract strictly requires an
ora-visual CLD envelope that the inline-only directive then overrides. The inline-only directive was honoured here — the edge-list table plus the ASCII hub sketch above are the inline rendering of the CLD. Resolves with: the mode file’s emission-contract section.
- R2 zero-sum: the loop’s strength rests on capacity being genuinely zero-sum between features and maintenance. Resolves with: domain input on whether a separate platform/maintenance team exists, plus the bug/maintenance-load series.
- R3 vs. cohort-mix: the below-baseline ratchet and a worsening cohort-mix produce near-identical aggregate waveforms. Resolves with: vintage-cohort (cohort-held) retention curves under a constant acquisition source.
- R1 cohort incidence: whether R1 loads existing cohorts or only new-cohort onboarding depends on feature discoverability/opt-in. Resolves with: load/abandonment data split by tenure cohort.
Two questions decide where to act: What does the actual cohort curve look like — flat-return or descending ratchet — and is there maintenance/bug-load data to confirm or drop R2?